The Full-stack Observability application provides various dashboards that display information about the performance metrics of web pages and mini programs, JavaScript errors, API requests, and resource access.
Prerequisites
User experience data is collected. For more information, see Collect user experience data from web pages and Collect user experience data from mini programs.
Entry point
Log on to the Simple Log Service console.
In the Log Application section, click the Intelligent O&M tab. Then, click Full-stack Observability.
On the Simple Log Service Full-stack Observability page, click the instance you want.
In the left-side navigation pane, choose .
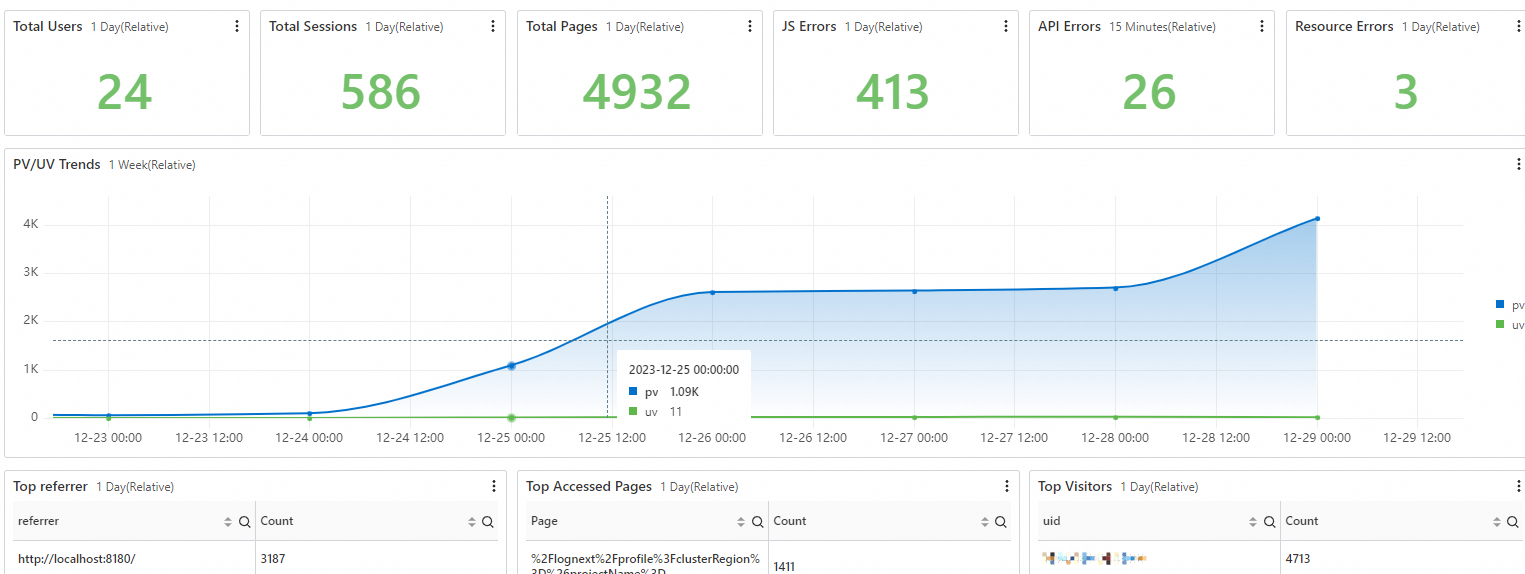
Overview
The Overview dashboard displays the overall statistics of user access in charts. The charts include Total Users, Total Sessions, Total Pages, JS Errors, API Errors, Resource Errors, and Trends.
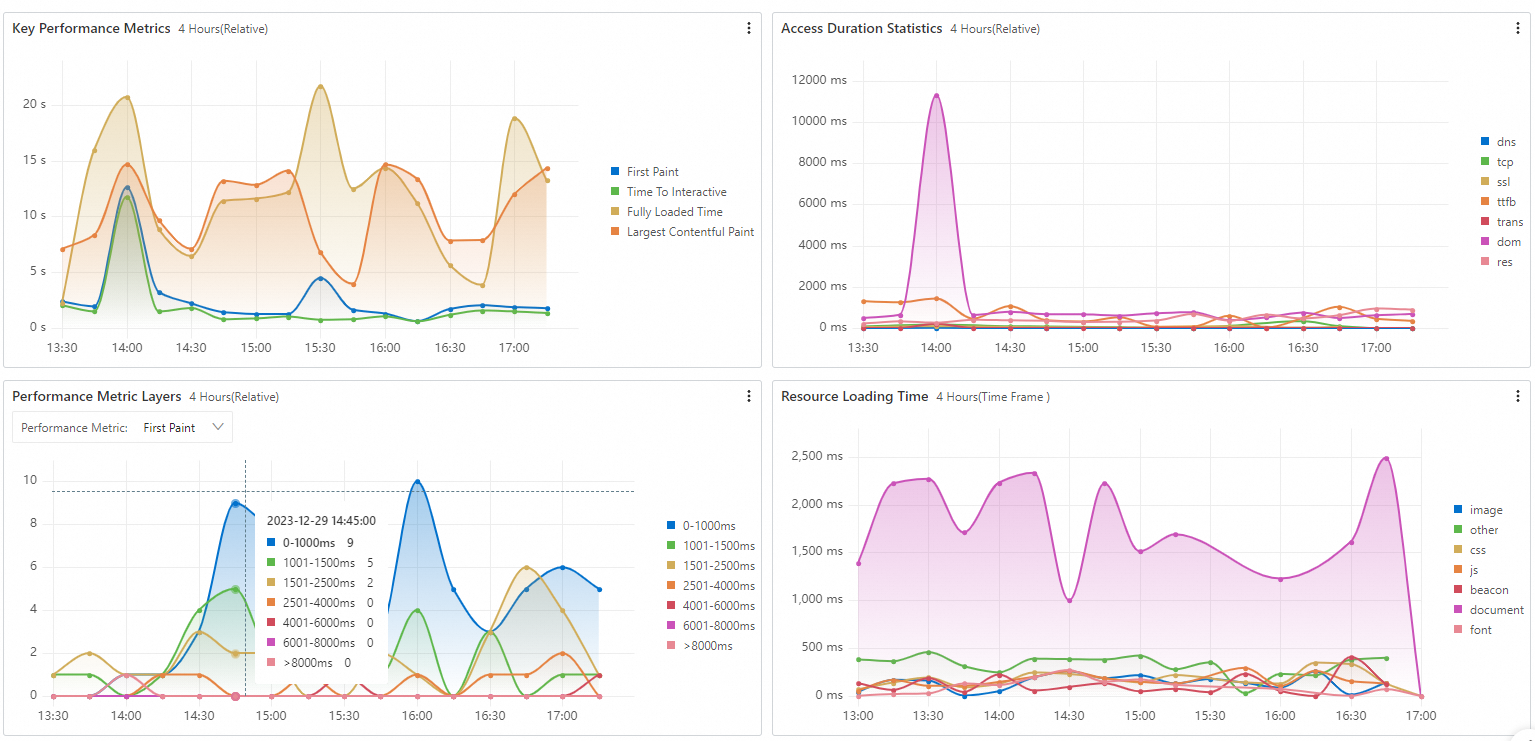
Performance Overview
The Performance Overview dashboard displays the overall statistics of performance data in charts. The charts include Key Performance Metrics, Frequently-accessed Page Performance, Access Duration Statistics, Performance Metric Layers, and Resource Loading Time. The Key Performance Metrics chart includes the following metrics: First Paint, Time to Interactive, Fully Loaded Time, and Largest Contentful Paint.
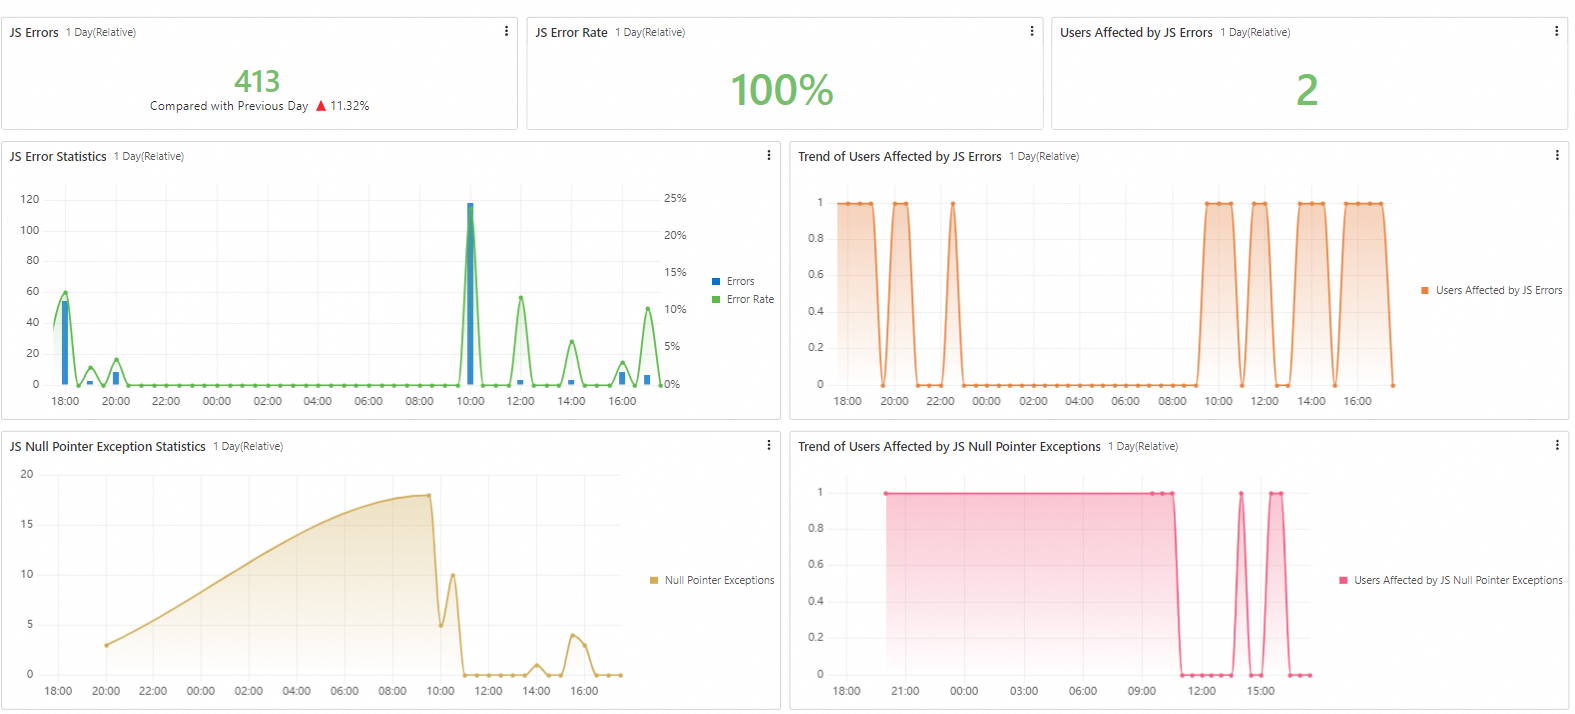
JS Error Overview
The JS Error Overview dashboard displays the detailed information about JavaScript errors in charts. The charts include JS Errors, JS Error Rate, and Users Affected by JS Errors.
API Request Overview
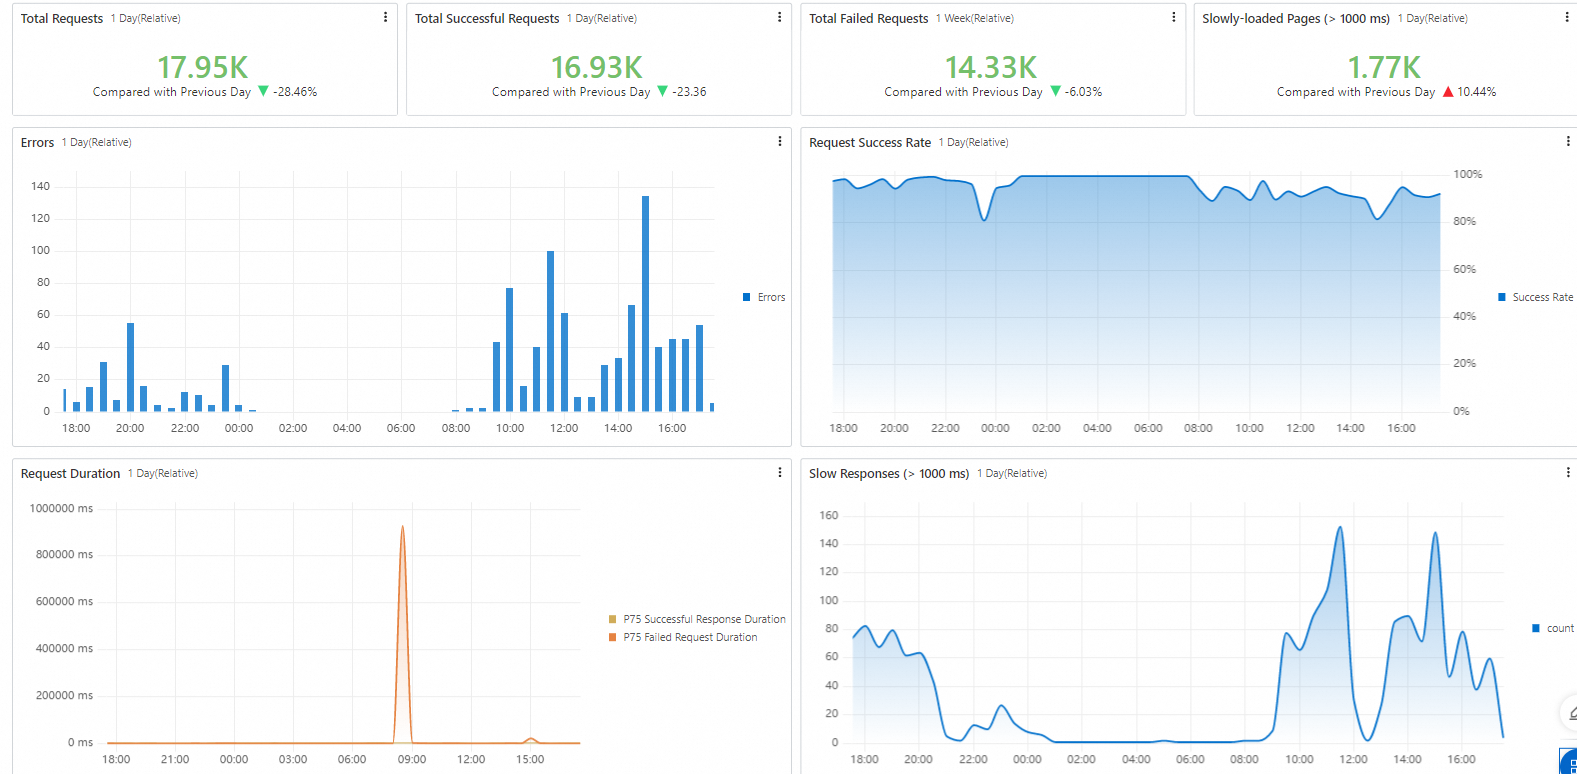
The API Request Overview dashboard displays the detailed information about API requests in charts. The charts include Total Requests, Total Successful Requests, Total Failed Requests, and Slowly-loaded Pages.
Resource Access Overview
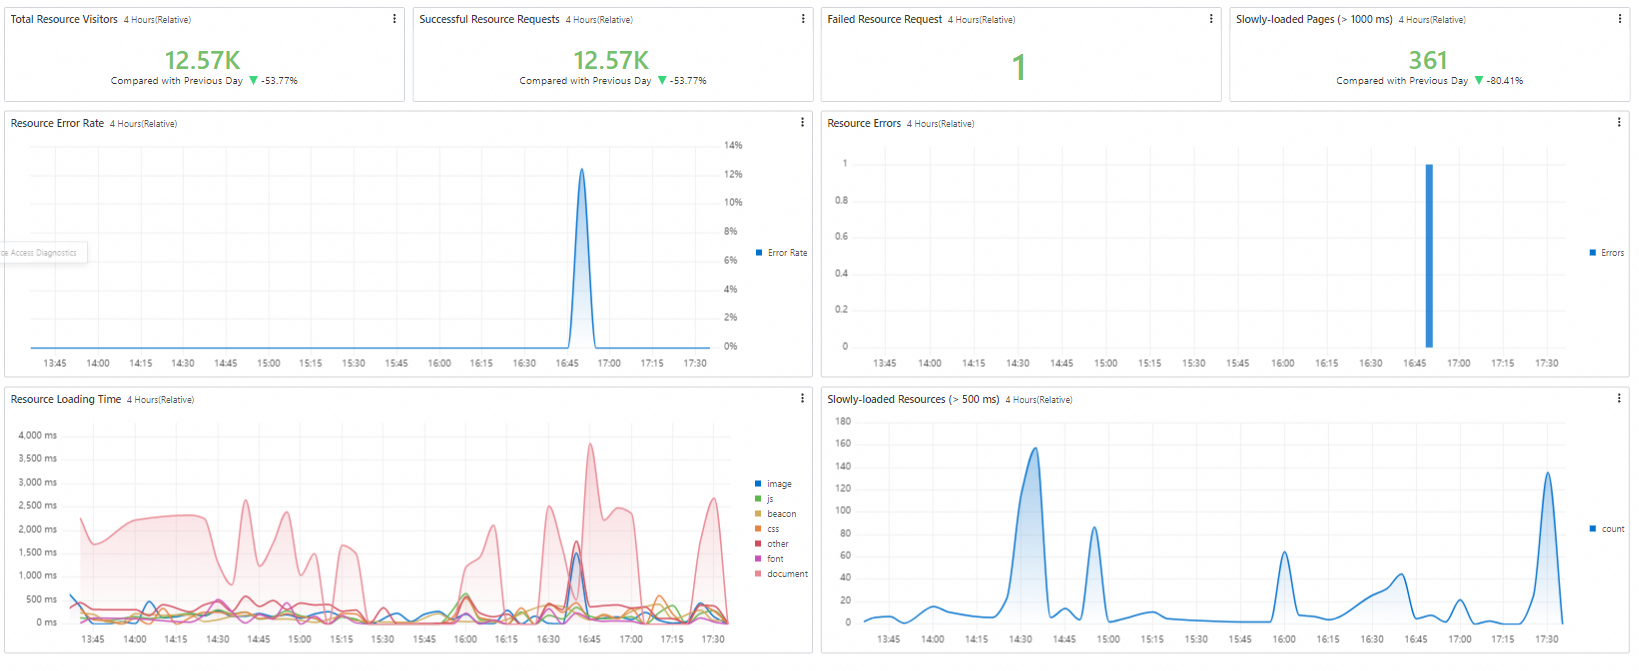
The Resource Access Overview dashboard displays the detailed information about resource access in charts. The charts include Total Resource Visitors, Successful Resource Requests, Failed Resource Request, Slowly-loaded Pages, and Resource Loading Time.
Device Statistics
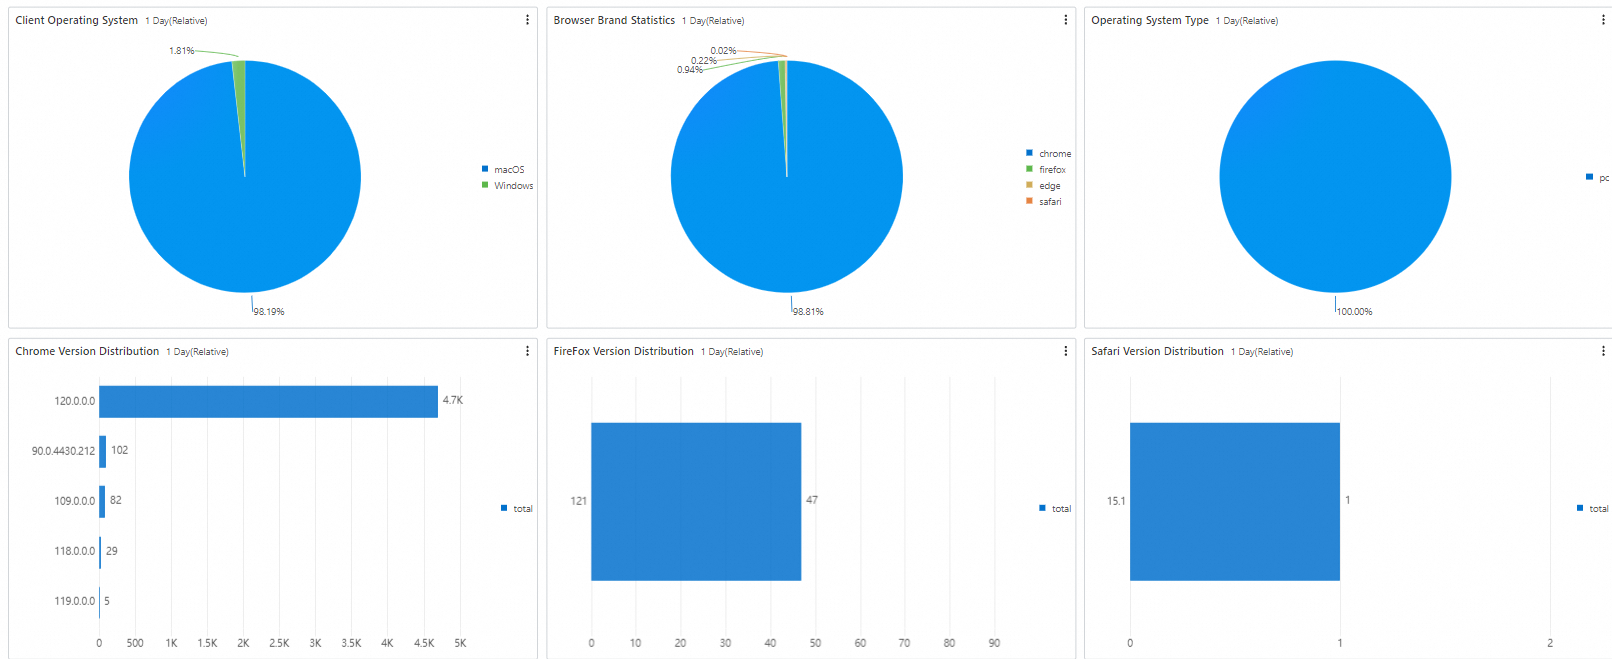
The Device Statistics dashboard displays the information about client devices in charts. The charts include Client Operating System, Browser Brand Statistics, Operating System Type, Chrome Version Distribution, FireFox Version Distribution, Safari Version Distribution, Browser Window Size, and Monitor Resolution.
JS Error Diagnostics
The JS Error Diagnostics dashboard displays the information about JavaScript errors in charts. The charts include Top 100 Pages by Error Rate, Frequent Errors, and Frequent Null Pointer Exceptions.
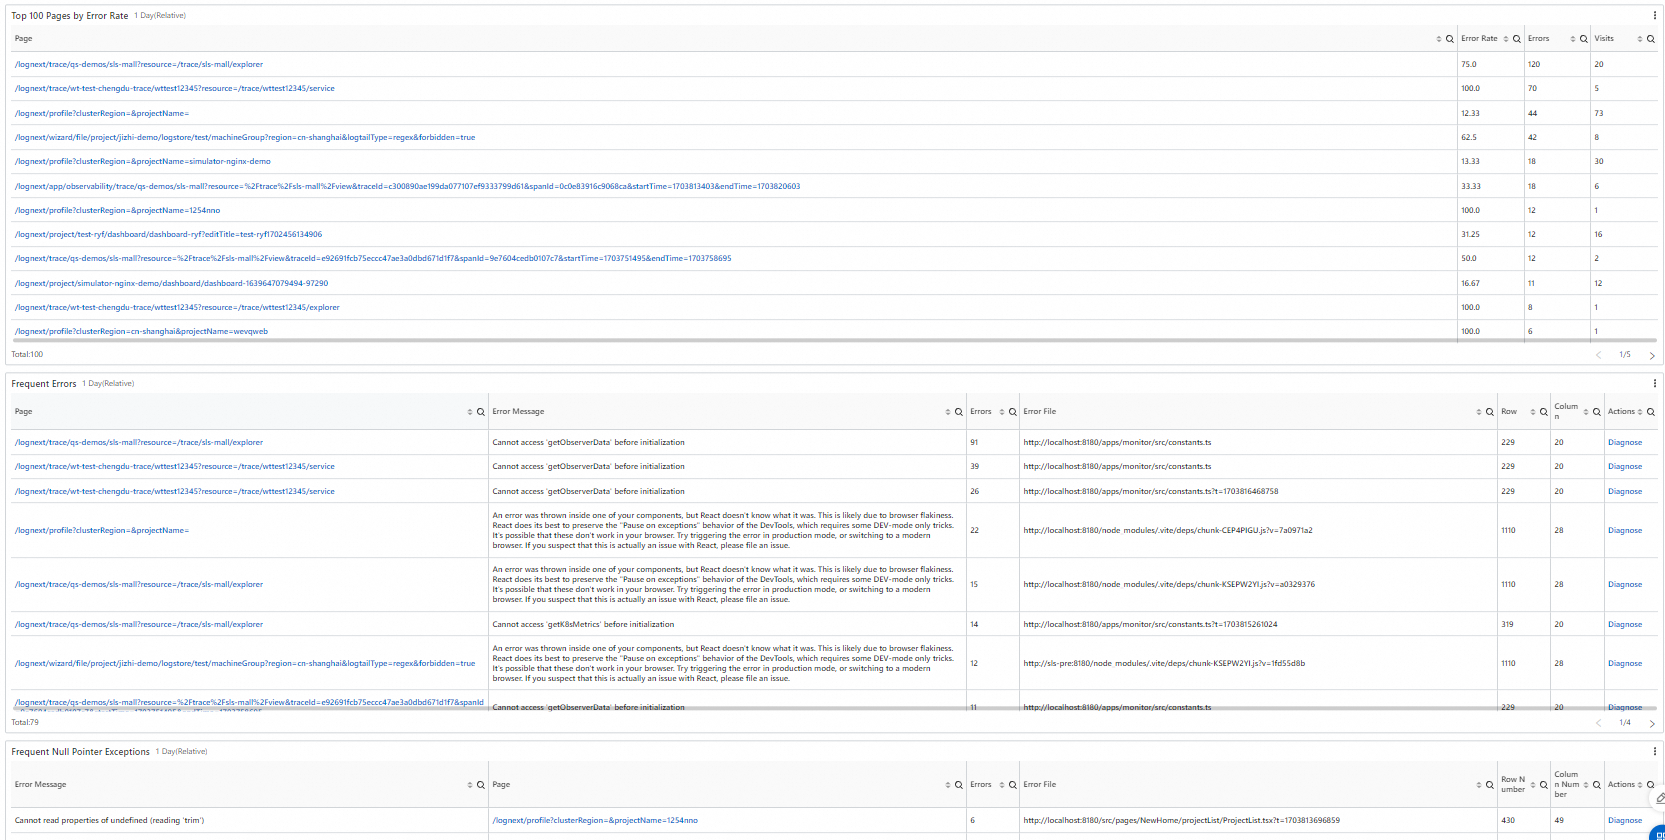
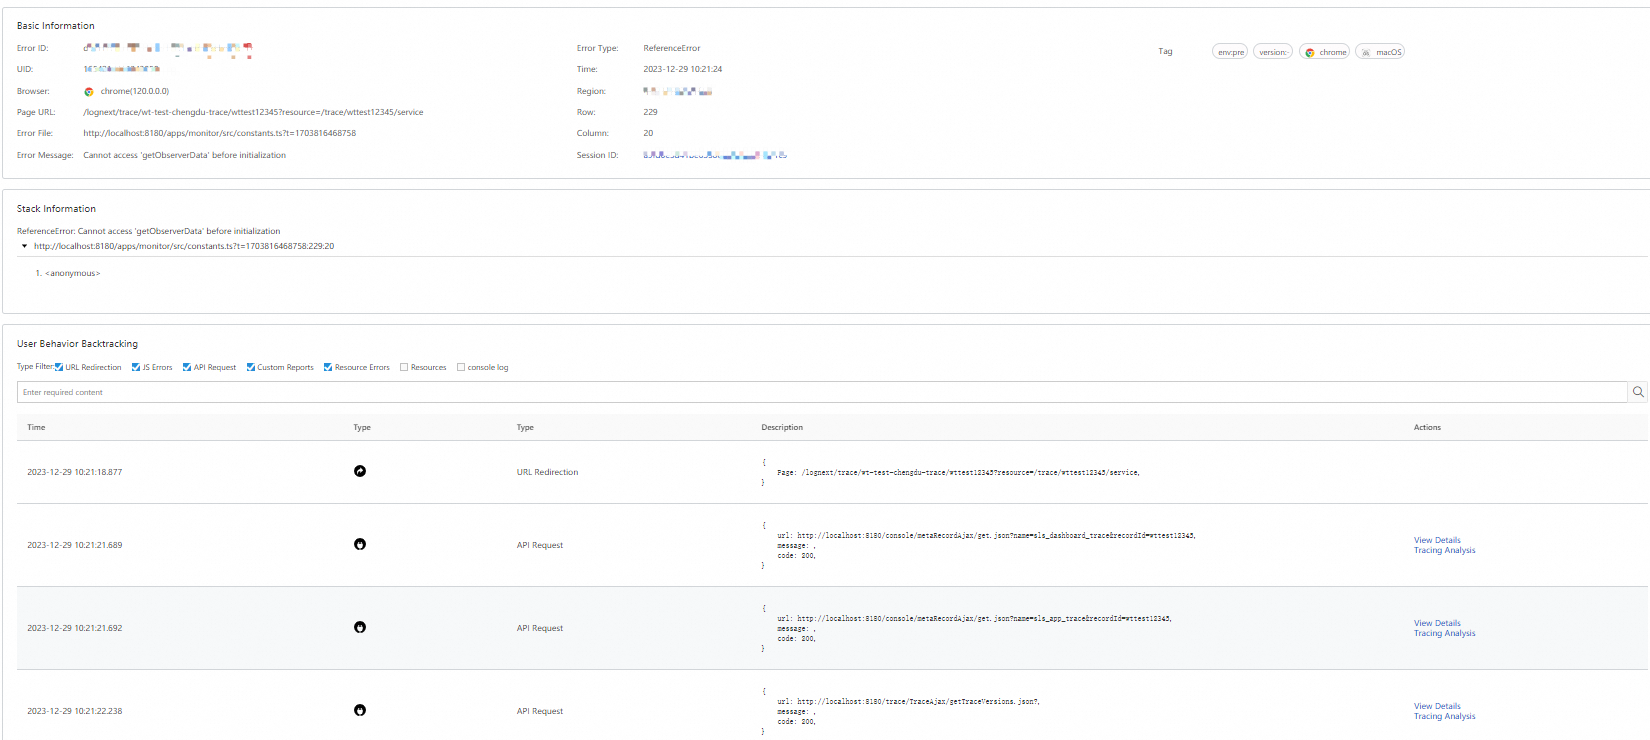
To view the details of a JavaScript error, such as Stack Information or User Behavior Backtracking, find the error and click Diagnose in the Actions column.
API Request Diagnostics
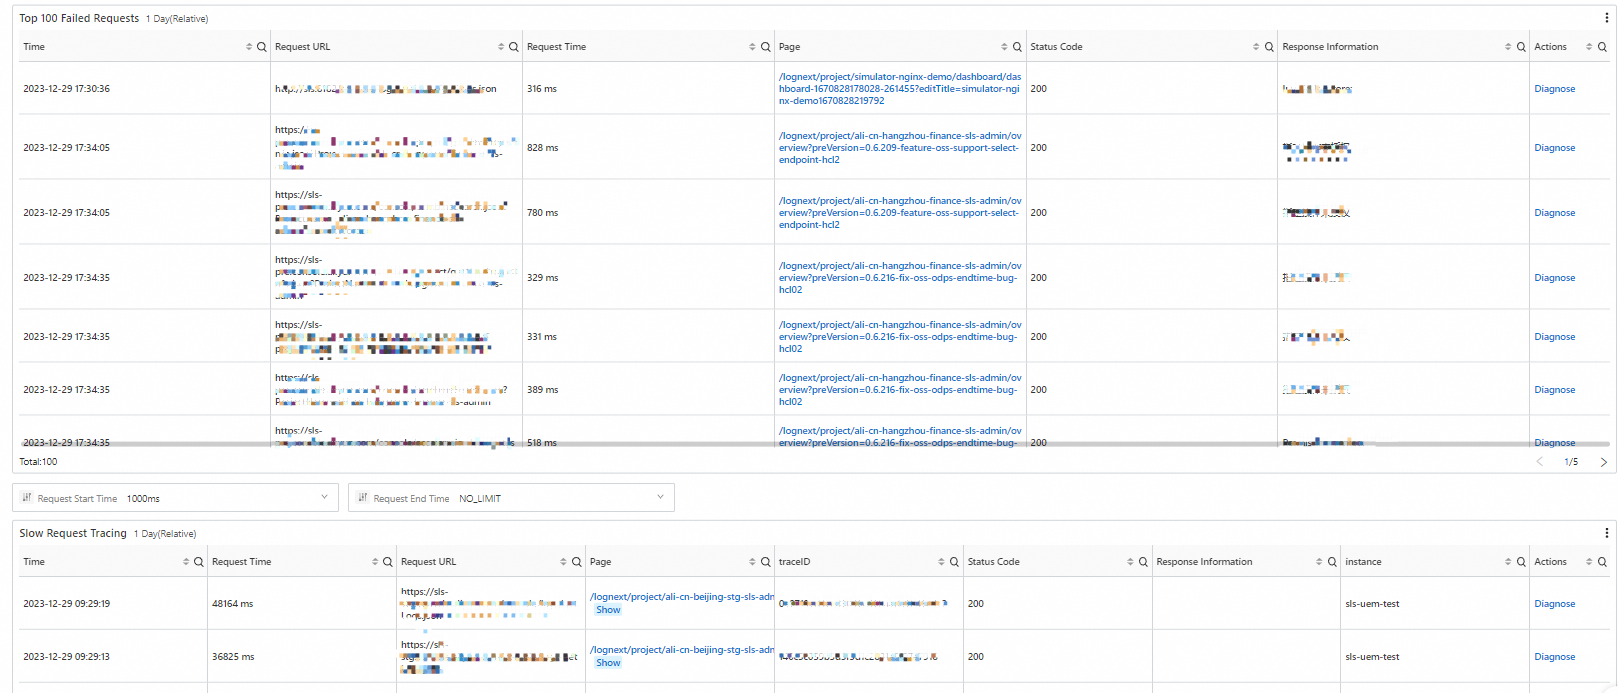
The API Request Diagnostics dashboard displays the information about API requests in charts. The charts include Top 100 Failed Requests and Slow Request Tracing.
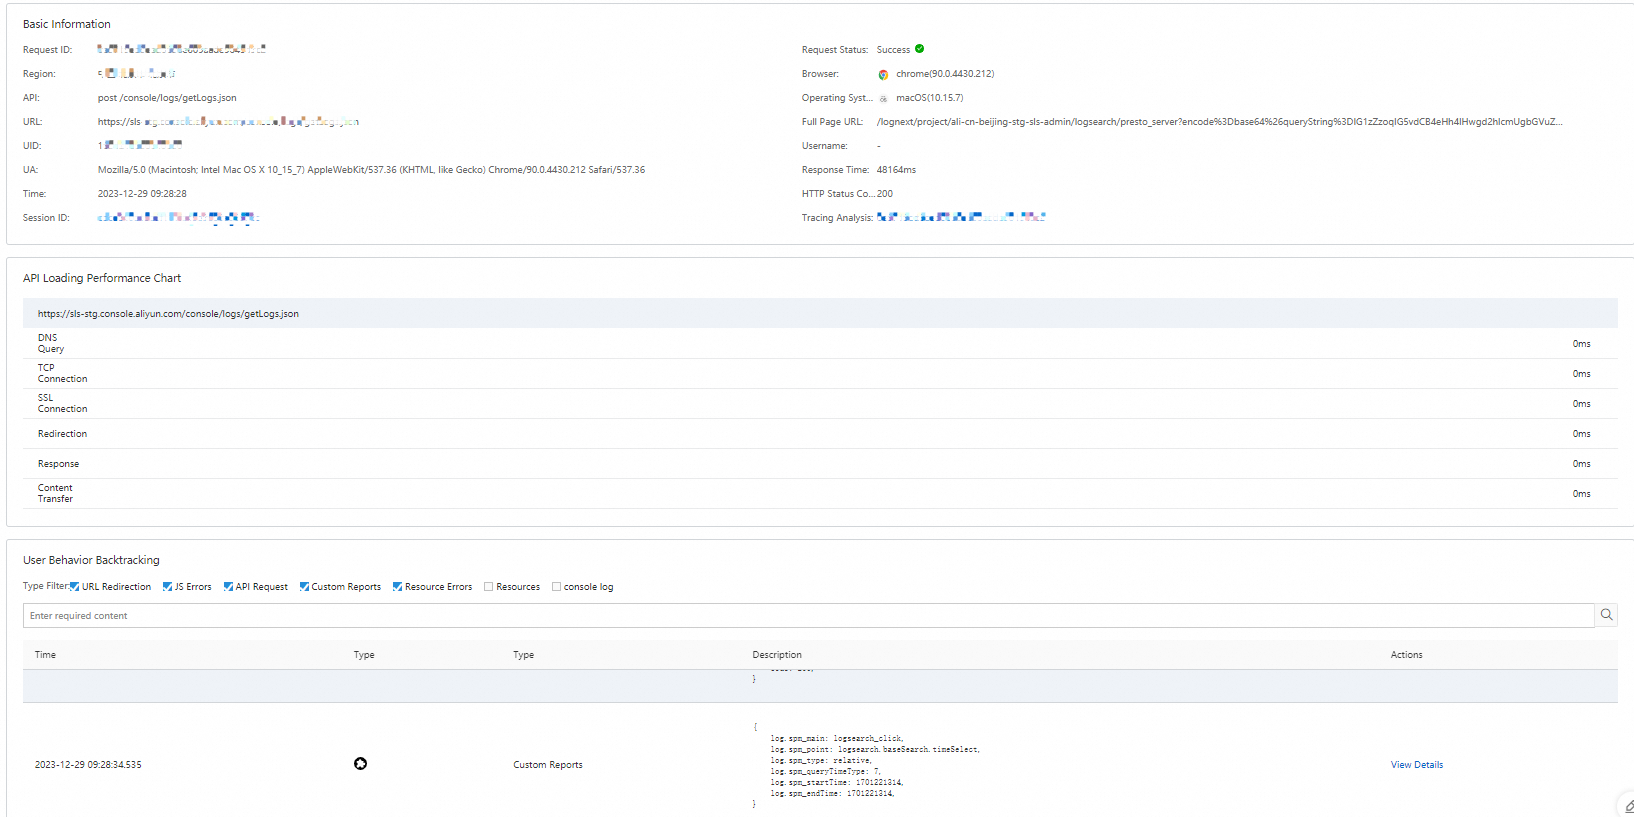
To view the details of an API request, such as API Loading Performance Chart or User Behavior Backtracking, find the API request and click Diagnose in the Actions column.
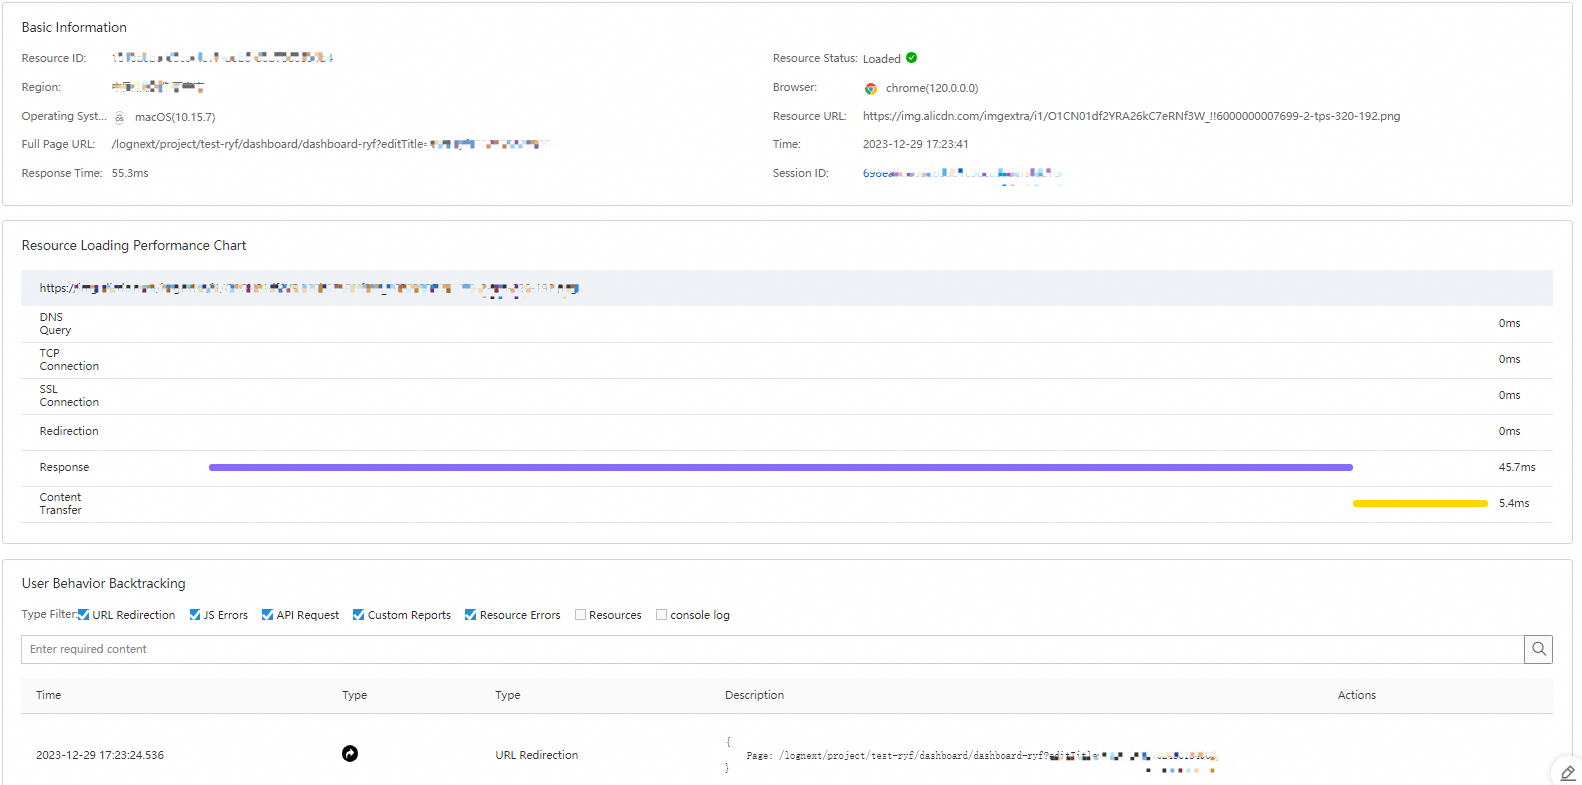
Resource Access Diagnostics
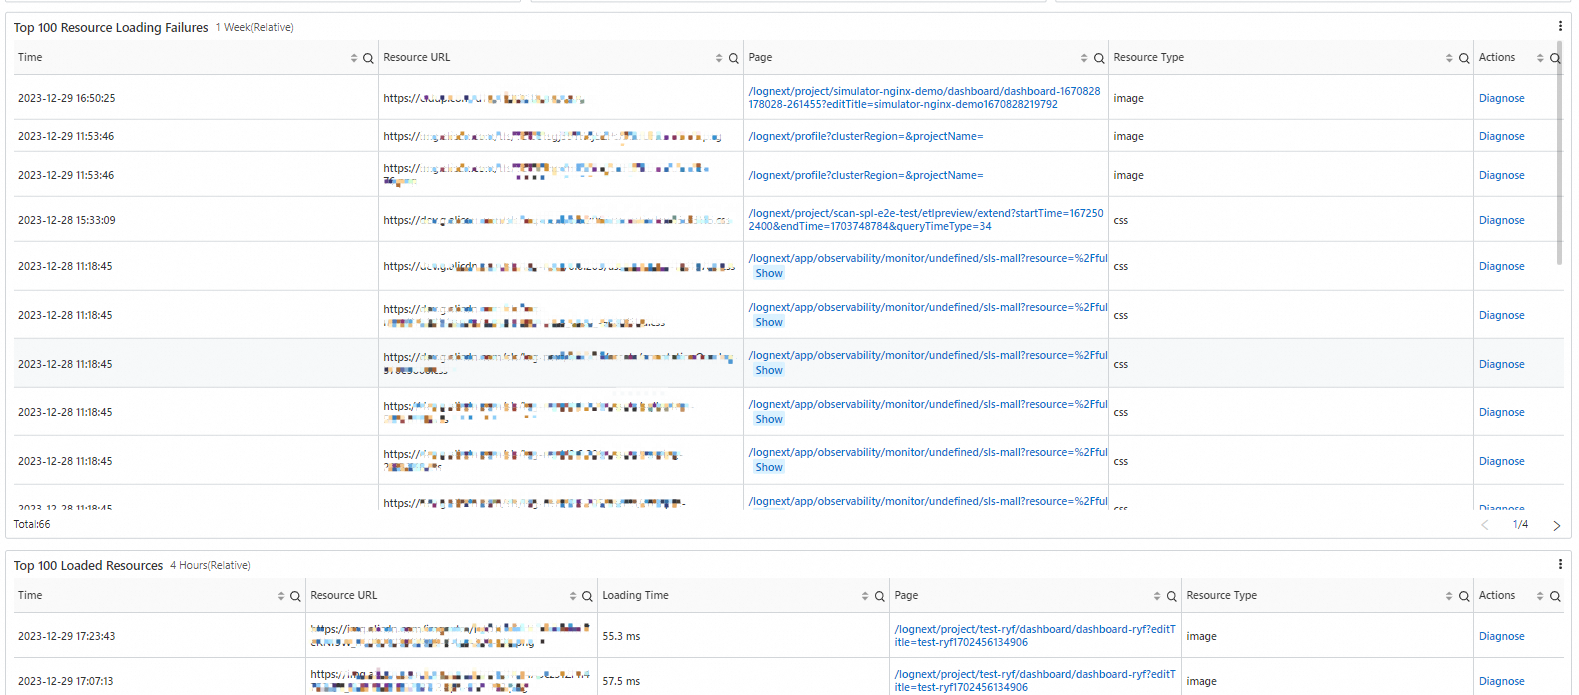
The Resource Access Diagnostics dashboard displays the diagnostic information about resource access in charts. The charts include Top 100 Resource Loading Failures and Top 100 Loaded Resources.
To view the details of a resource, such as Resource Loading Performance Chart or User Behavior Backtracking, find the resource and click Diagnose in the Actions column.
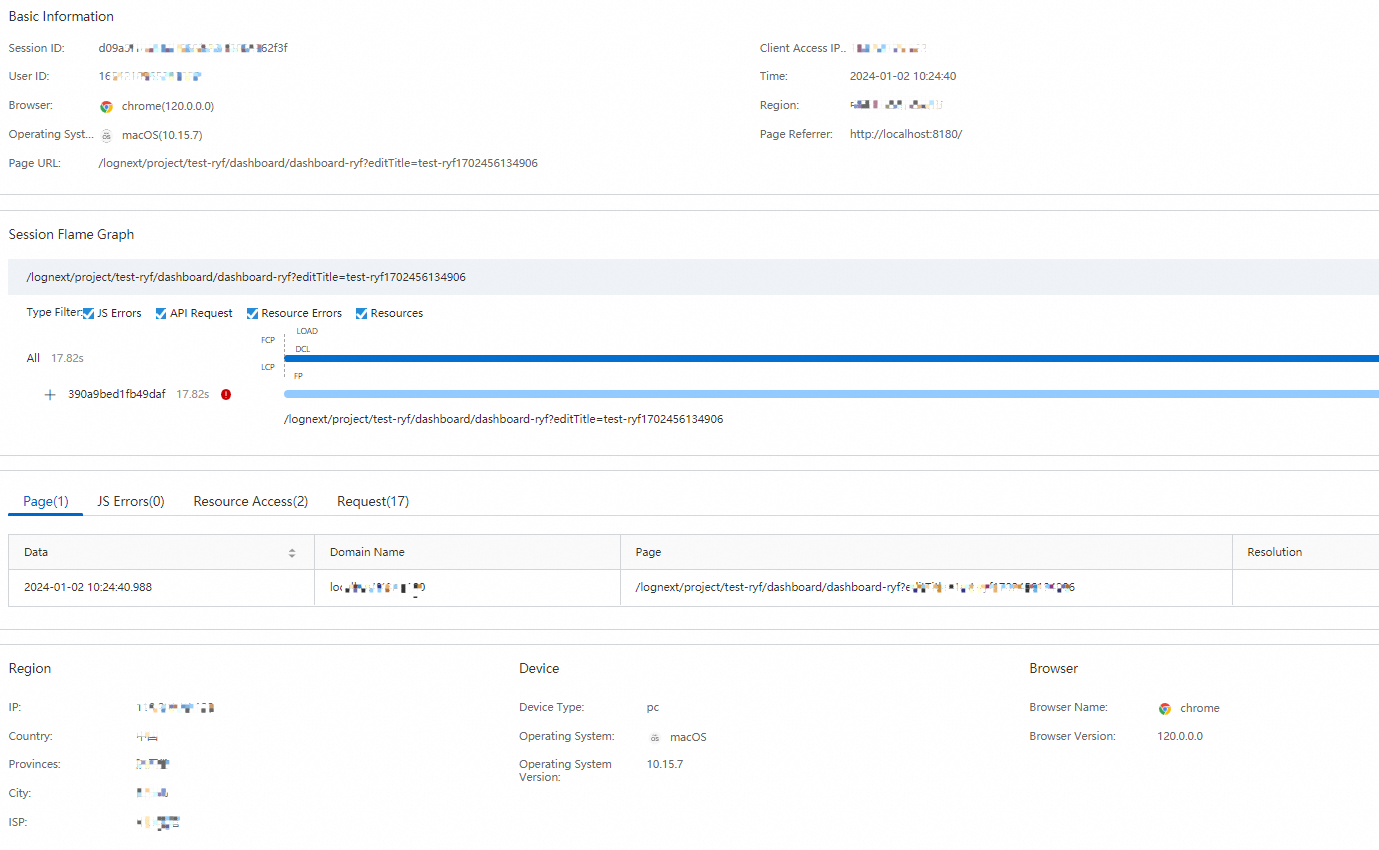
Session Tracing
The Session Tracing dashboard displays the detailed information about sessions in charts. The information includes Visited Page, UID, Browser, Browser Version, Country, City, and ISP.
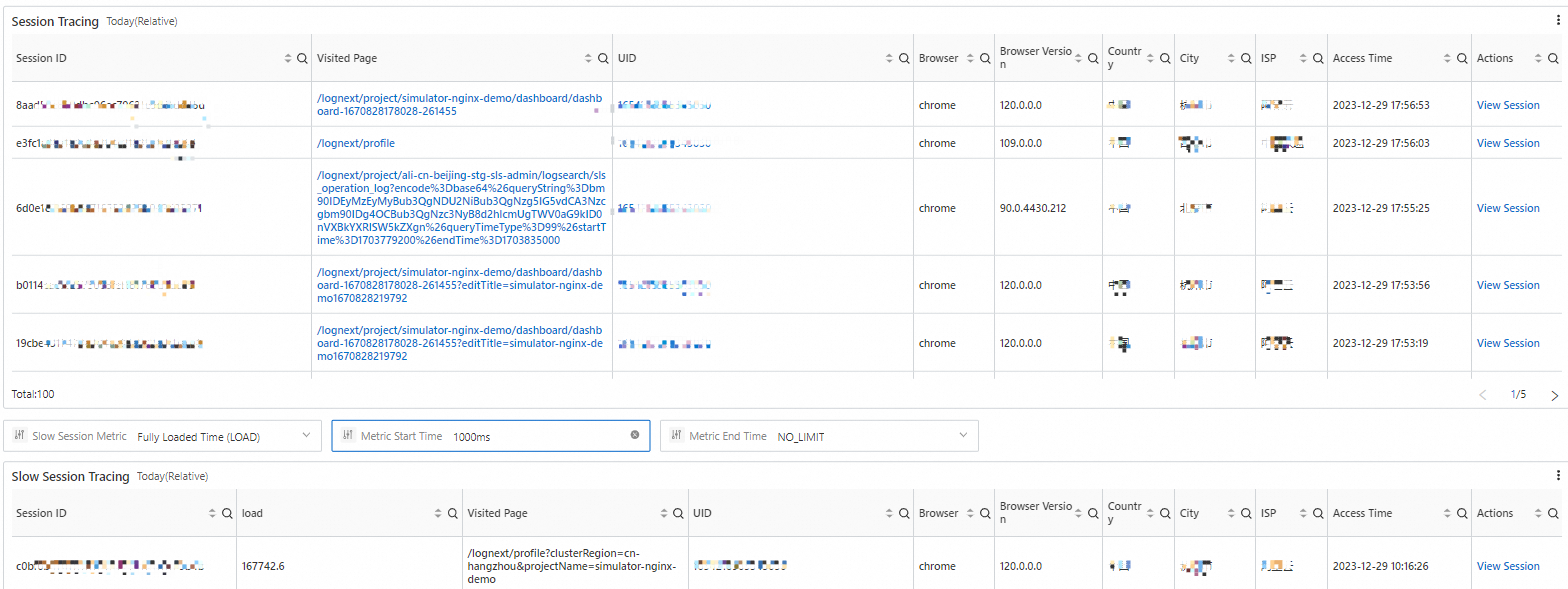
To view the details of a session, such as Session Homepage Loading Performance Chart or Session Flame Graph, find the session and click View Session in the Actions column. You can also view the session statistics of different monitored objects, including pages, JavaScript errors, resource access, and requests.