After you create a simple application server, you can view its details in the Simple Application Server console, such as the configurations, expiration time, and resource usage.
View the basic information of a server
You can view the basic information of the server, such as the server ID, server name, status, configuration information, IP address, and expiration time, on the Server Overview tab. You can also perform operations such as remote connection and password resetting on the server.
Go to the Servers page in the Simple Application Server console.
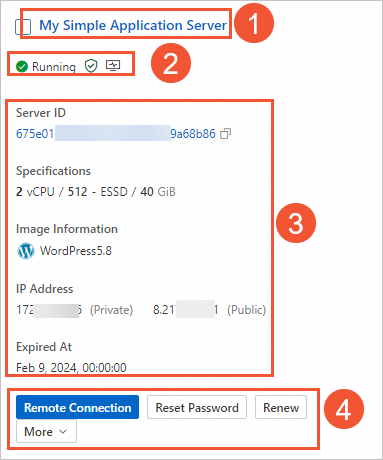
On the Servers page, you can view the basic information of all simple application servers in the current account. The following figure shows the basic information of a server.
NoteIf you have multiple servers, you can search for a server by specifying a fuzzy server name, or exact server name, public IP address, or status in the search box.
Description of major information
①: Server name.
NoteYou can modify the server name by moving the pointer over the server name and then clicking the
 icon.
icon.②: The running status, security, and monitoring information of the server.
For more information about running statuses of servers, see Lifecycle of a simple application server.
You can move the pointer over the
 icon to view the firewall informaiton of the server. A
 icon indicates that the firewall, or default ports 22, 80, and 443 on the server are disabled. You need to enable the firewall or ports.
You can move the pointer over the
 icon and click View Monitoring Data to view the monitoring infomation about the server. For more information, see View the monitoring information of a simple application server.
③: The major information about the server, including the ID, specifications, image, IP address, and expiration time of the server.
NoteYou can move the pointer over the ID or IP address of the server and then click the
 icon to copy the ID or IP address.
④: Operation buttons of the server, such as remote conneciton, password resetting, and renewal.
WarningStopping or restartting the server can interrupt your business. Proceed with caution.
View the details of a server on the Server Overview page
You can view the basic information such as the Server ID, Status, and IP Address of the server. You can also view the usage of resources such as Data Transfers and the CPU, the Firewall status, the installation and usage status of the Command Assistant and CloudMonitor agent.
Log on to the Simple Application Server console.
Click the Server ID in the Basic Information section of the simple application server that you want to view.
On the Server Overview page, view the sections described in the following table.
Section
Description
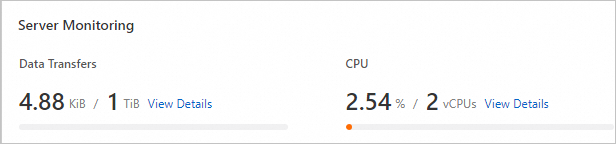
Server Monitoring
Shows the data transfer quota usage, CPU utilization, memory size, system disk size, and data disk size of the server. You can click View Details to view the detailed monitoring data of the server. If you want to view examples on the data transfer quota usage, see the "Example: View the data transfers of servers" section of this topic.
Basic Information
Shows information about Server ID, Image Information, IP Address, and Expire At.
Application building guide
Shows an application building wizard. You can follow the wizard to build an application on the server with efficiency.
Command Assistant
Shows the installation status of Command Assistant.
If Command Assistant is installed, you can click Run Command to perform O&M operations on the server without logging on to the server. For more information, see Run a command.
If Command Assistant is uninstalled, you can follow the on-screen instructions to install the Cloud Assistant agent.
Related Services
Shows related services such as Elastic Compute Service (ECS) and WUYING Workspace. You can click a service to navigate to the official website of the service.
Example: View the data transfers of servers
Query the data transfer quota usage of a single simple application server
Go to the Servers page in the Simple Application Server console.
On the Servers page, click the ID of the server that you want to query.
On the Server Monitoring section of the Server Overview tab, view the data transfer quota usage (Used/Total) of the server.
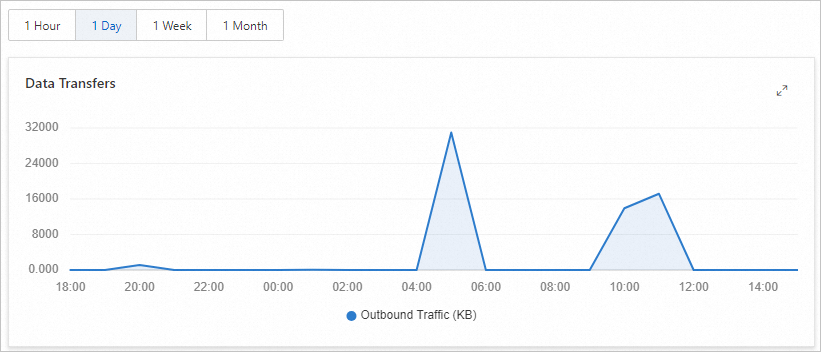
Click View Details to view the daily data transfer of the server.
NoteOn the Metrics page, you can view the disks, CPU utilization, memory usage, network bandwidth usage, and traffic details of the server by time.
The query cycle of data transfers is no less than one hour. If you query the data transfers that are used within the last one hour, no data is displayed.
Query the data transfer quota usage of all simple application servers
You can filter data by hour within a specific time period to download and view the usage details of simple application servers.
Log on to the Expenses and Costs console.
In the left-side navigation pane, choose .
On the View Usage Details tab, configure the following parameters.
Parameter
Description
Product
Select Simple Application Server.
Billable Item
Select Simple Application Server.
Time Period
Select the time range for the query. You can query and export usage records of recent 12 months. To query information beyond the period, submit a ticket.
You can query the resource usage of only one calendar month each time. For example, if you set the start time to 2022-02-01, the latest end time that you can specify for the time range is 2022-02-28. You cannot select 2022-03-01 as an end time.
Time Unit
Select Hour.
Click Export CSV.
After the CSV file is exported, you can download the file to your on-premises device to view the usage details of your simple application servers.