After you deploy an application in SAE, you can use health checks to monitor the health of your applications and services. This helps you identify issues when exceptions occur. SAE lets you configure health checks when you create or deploy an application. This topic describes how to configure health checks in the SAE console.
Background information
Health check principles
A health check is a process where a liveness probe, readiness probe, or startup probe periodically checks an application instance. The results are then sent to the SAE console. This helps you monitor the overall health of your service in a cluster environment and identify issues.
SAE is based on Kubernetes and provides the following three types of health checks.
Application instance liveness check (Liveness configuration): Checks an application instance to determine if it is running correctly.
Success: The application instance is healthy. SAE takes no action.
Failure: The application instance is unhealthy. SAE restarts the application instance.
Application service readiness check (Readiness configuration): Checks the application service to determine if it is ready to handle incoming traffic.
Success: The application is ready. SAE allocates service traffic to the application.
Failure: The application is not ready. SAE does not allocate service traffic to the application.
Application startup probe (StartupProbe configuration): Checks if the application has started successfully.
Success: The application started successfully. If you also configured liveness and readiness probes, they will begin to run after the startup probe succeeds.
Failure: The application failed to start. SAE automatically restarts the instance.
Success and failure criteria
Success: A check is considered successful after the number of consecutive successful probes reaches the specified Healthy Threshold.
Failure: If a health check fails, SAE continues to probe at the configured interval. If the number of consecutive failures reaches the specified Unhealthy Threshold, SAE takes action. For a failed liveness probe, SAE restarts the instance. For a failed readiness probe, SAE stops sending traffic to the instance.
Health check parameters
SAE uses the following parameters to check the health of application instances and applications.
Initial Delay
The delay from when an application starts to when the first probe is initiated. This value must be longer than the normal startup time of the application. Otherwise, the health check may fail during application deployment or runtime, which can cause repeated restarts. For example, if an application takes 60 seconds to start, you should set the initial delay to 70 seconds.
Timeout
The timeout for a single probe, in seconds. The default value is 1. For example, if you set the timeout to 10 seconds, a probe is considered failed if it does not return a response within 10 seconds. If you set this parameter to 0 or leave it empty, the default value of 1 second is used.
Period
The interval between health checks, in seconds. The default value is 30. For example, if you set the period to 5 seconds, a health check is performed every 5 seconds. When the application container first starts, SAE may perform the readiness probe more frequently than the configured period. This allows the instance to begin processing requests sooner, improving the service's startup speed and overall user experience.
Access points
Create an application
On the SAE Application List page, select a destination region and namespace in the top navigation bar, and then click Create Application. On the Application Basic Information page, configure the parameters and click Next: Advanced Settings.
Change a running application
WarningAfter you redeploy an application, the application is restarted. To prevent unpredictable errors such as business interruptions, we recommend that you deploy applications during off-peak hours.
On the SAE Application List page, select a destination region and namespace in the top navigation bar. Click the ID of the target Application to open the application details page.In the navigation pane on the left, click Basic Information. In the upper-right corner, click Deploy Application.
Change a stopped application
On the SAE Application List page, select a destination region and namespace in the top navigation bar. Click the ID of the target Application to open the application details page.Click Basic Information, and then click Modify Application Configuration.
Expand the Application Health Check Settings section and configure the parameters as needed.
Configuration guide
As needed, Enable Application Instance Liveness Check (Liveness Configuration), Enable Application Business Readiness Probe (Readiness Configuration), or Enable StartupProbe Configuration. The configuration parameters are the same for all three probe types.
NoteYou can configure liveness, readiness, and startup probes individually or in combination. We recommend configuring all three.
If you configure all three health checks, the startup probe runs first. After the startup probe succeeds, the liveness and readiness probes begin to run based on their configured initial delays.
Select a Check Method from the following options and configure its parameters.
HTTP Request Check: Sends an HTTP request to the instance to check its health. If the returned HTTP status code is between 200 and 399, the instance is considered healthy. Otherwise, the instance is considered unhealthy.
TCP Port Check: Establishes a TCP socket connection with the instance to check its health. If the connection is successful, the instance is considered healthy. If the connection fails, the instance is considered unhealthy.
Executable Command Check: Executes a probe command inside the instance to check its health. If the command returns a status code of 0, the instance is considered healthy. If the status code is not 0, the instance is considered unhealthy.
HTTP request check
Configuration item
Description
Path
The path to access on the HTTP server.
Port
The port to access on the HTTP server.
HTTP Advanced Settingss
Expand HTTP Advanced Settings and choose whether to check if the returned string contains a specified keyword.
Protocol
Select HTTP or HTTPS.
Latency (Seconds)
The time to wait after an application starts before the first probe is initiated. The initial delay must be longer than the normal startup time of the application. Otherwise, the health check will fail during application deployment or runtime, causing repeated restarts. For example, if an application takes 60 seconds to start, set the initial delay to 70 seconds.
Timeout Period (Seconds)
The timeout for a probe. The unit is seconds. The default value is 1 second. For example, if you set the timeout to 10 seconds, a probe that takes longer than 10 seconds is considered a failure, and a timeout exception is reported. If you set this parameter to 0 or leave it empty, the default timeout of 1 second is used.
Check Interval (Seconds)
The interval for performing health checks. The unit is seconds. The default value is 30 seconds. For example, if you set the period to 5 seconds, a check is performed every 5 seconds. When the application container first starts, SAE may execute the readiness probe more frequently than the configured period. This policy allows the instance to start processing requests as soon as possible, which improves the startup speed and overall user experience of the service.
Healthy Threshold (Times)
The minimum number of consecutive successes for the probe to be considered successful after having failed. This must be set to 1 for liveness probes.
Unhealthy Threshold (Times)
The number of consecutive failures after which the probe is considered to have failed.
TCP port check
Configuration item
Description
TCP Port
The port to access for the TCP check.
Latency (Seconds)
The time to wait after an application starts before the first probe is initiated. The initial delay must be longer than the normal startup time of the application. Otherwise, the health check will fail during application deployment or runtime, causing repeated restarts. For example, if an application takes 60 seconds to start, set the initial delay to 70 seconds.
Timeout Period (Seconds)
The timeout for a probe. The unit is seconds. The default value is 1 second. For example, if you set the timeout to 10 seconds, a probe that takes longer than 10 seconds is considered a failure, and a timeout exception is reported. If you set this parameter to 0 or leave it empty, the default timeout of 1 second is used.
Check Interval (Seconds)
The interval for performing health checks. The unit is seconds. The default value is 30 seconds. For example, if you set the period to 5 seconds, a check is performed every 5 seconds. When the application container first starts, SAE may execute the readiness probe more frequently than the configured period. This policy allows the instance to start processing requests as soon as possible, which improves the startup speed and overall user experience of the service.
Healthy Threshold (Times)
The minimum number of consecutive successes for the probe to be considered successful after having failed. This must be set to 1 for liveness probes.
Unhealthy Threshold (Times)
The number of consecutive failures after which the probe is considered to have failed.
Executable Command Check
Configuration item
Description
Latency (Seconds)
The time to wait after an application starts before the first probe is initiated. The initial delay must be longer than the normal startup time of the application. Otherwise, the health check will fail during application deployment or runtime, causing repeated restarts. For example, if an application takes 60 seconds to start, set the initial delay to 70 seconds.
Timeout Period (Seconds)
The timeout for a probe. The unit is seconds. The default value is 1 second. For example, if you set the timeout to 10 seconds, a probe that takes longer than 10 seconds is considered a failure, and a timeout exception is reported. If you set this parameter to 0 or leave it empty, the default timeout of 1 second is used.
Check Interval (Seconds)
The interval for performing health checks. The unit is seconds. The default value is 30 seconds. For example, if you set the period to 5 seconds, a check is performed every 5 seconds. When the application container first starts, SAE may execute the readiness probe more frequently than the configured period. This policy allows the instance to start processing requests as soon as possible, which improves the startup speed and overall user experience of the service.
Healthy Threshold (Times)
The minimum number of consecutive successes for the probe to be considered successful after having failed. This must be set to 1 for liveness probes.
Unhealthy Threshold (Times)
The number of consecutive failures after which the probe is considered to have failed.
Command
The health check command to execute inside the application instance or process. If the command returns 0, the application is considered healthy. For more information about health check commands, see Configure Probes in the Kubernetes documentation.
NoteSAE provides two different shell interpreters for you to choose from:
>_ /bin/sh
>_ /bin/bash
For example, if you set the command to
cat /tmp/healthy, SAE periodically checks if the/tmp/healthyfile exists. If the file exists, the command returns 0, which indicates that the command was successful.
Authentication results
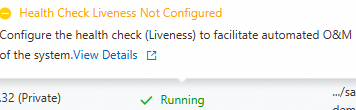
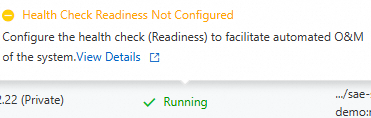
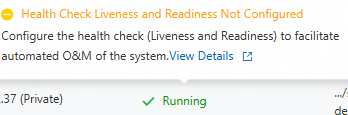
After you configure the health checks, navigate to the Basic Information page of the target application. Click the Instances tab. In the Default Group area, you can view the running status of the instances. Hover over the flag next to the status to view the health check configuration details.
Running Status | Description |
| A health check is not configured for the instance. Note
|
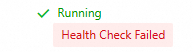
Liveness and Readiness health checks failed
| The health check failed. The instance is unhealthy. Note You can hover over the instance status to view the reason for the failure. You can also click Troubleshooting Guide for troubleshooting steps. |
Health check passed
| The health check passed. The instance is healthy. |

Common causes of health check failures
The initial delay is too short. The health check started before the application finished its startup process. Increase the delay and try again.
The health check configuration is incorrect. Verify the port and interface settings.
The service is under excessive load. You can verify this by checking the application monitoring data. If this is the cause, you can increase the number of instances, use a larger instance type, or reduce the JVM heap parameter settings.
The application failed to start. To diagnose this, try disabling the health checks. If the application still fails to start, you may need to optimize the application code.