When a job fails during startup or runtime, exception logs are your first stop for diagnosing the root cause. This topic covers three log types: JobManager exceptions, archived logs from failed TaskManagers, and logs from TaskManagers running slow checkpoints.
| Log type | When to use it |
|---|---|
| JobManager exceptions | The job failed due to a failover. Check this before diving into raw logs. |
| Failed TaskManager logs | A TaskManager crashed and restarted. View its archived logs to find the cause. |
| TaskManager logs for slow checkpoints | A checkpoint is taking too long. Trace the slow task back to its TaskManager logs. |
If the JobManager fails to start rather than failing during execution, that is a startup failure, not a JobManager exception. Check the startup logs instead.
Prerequisites
Before you begin, ensure that you have:
A job instance in the Running state
Log pagination
Logs are paginated. Each page displays up to 1 MB of logs, or roughly 8,000–9,000 lines. In most cases, the first page contains enough information to identify the issue. If the cause is not on the first page, switch to other pages.
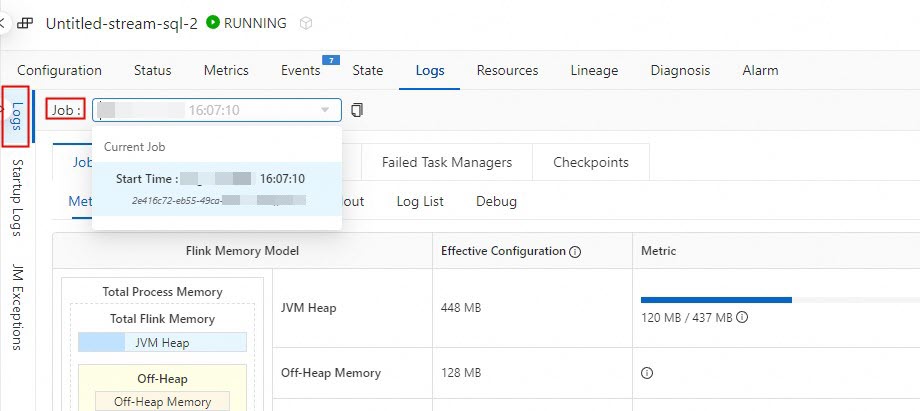
View JobManager exceptions
Log on to the Realtime Compute for Apache Flink console.
In the Actions column of the target workspace, click Console.
In the navigation pane on the left, click Operation Center > Job O&M, then click the name of the target job.
On the Job Log tab, click the Exception Information tab.
In Exception History, you can view exceptions from the last 7 days and filter them by type.

View logs of failed TaskManagers
Failed TaskManager logs are only available if log archiving is enabled, and only within the configured retention period.
Log on to the Realtime Compute for Apache Flink console.
In the Actions column of the target workspace, click Console.
In the navigation pane on the left, click Operation Center > Job O&M, then click the name of the target job.
On the Job Log tab, click the Operational Log tab, then select a job instance.
Click the Failed Task Managers tab.
A job in the Normal state has no failed TaskManagers. For high-risk jobs, a TaskManager may fail and restart — use the archived logs to find the potential cause.
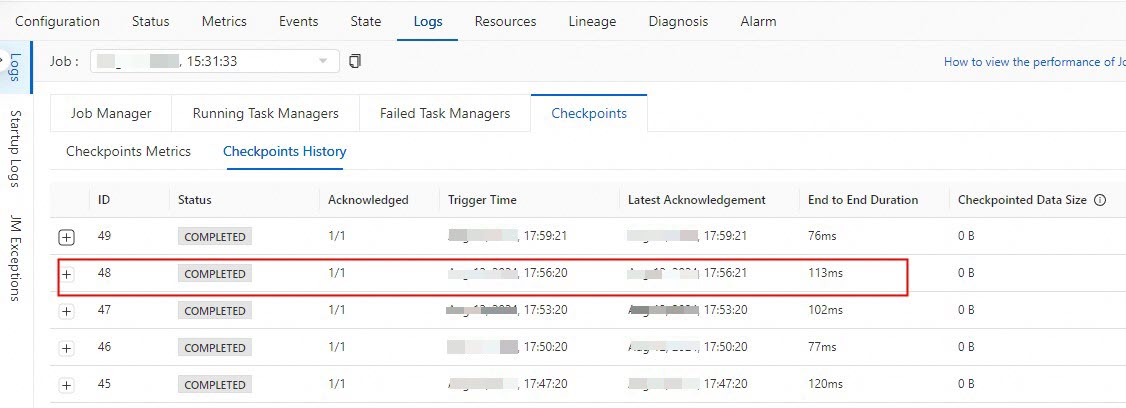
Locate slow checkpoints and view TaskManager logs
Use the End to End Duration column in Checkpoints History to identify slow checkpoints, then drill down to the TaskManager running the slow task.
Log on to the Realtime Compute for Apache Flink console.
In the Actions column of the target workspace, click Console.
In the navigation pane on the left, click Operation Center > Job O&M, then click the name of the target job.
On the Job Log tab, click the Checkpoints tab, then click Checkpoints History.
Check the End to End Duration column to identify checkpoints with a long duration.
Click the
 icon to the left of the slow checkpoint's ID to expand the Operators node.
Click the
icon to the left of the Operators node to view individual task details.Click the ID of the task with a long duration.
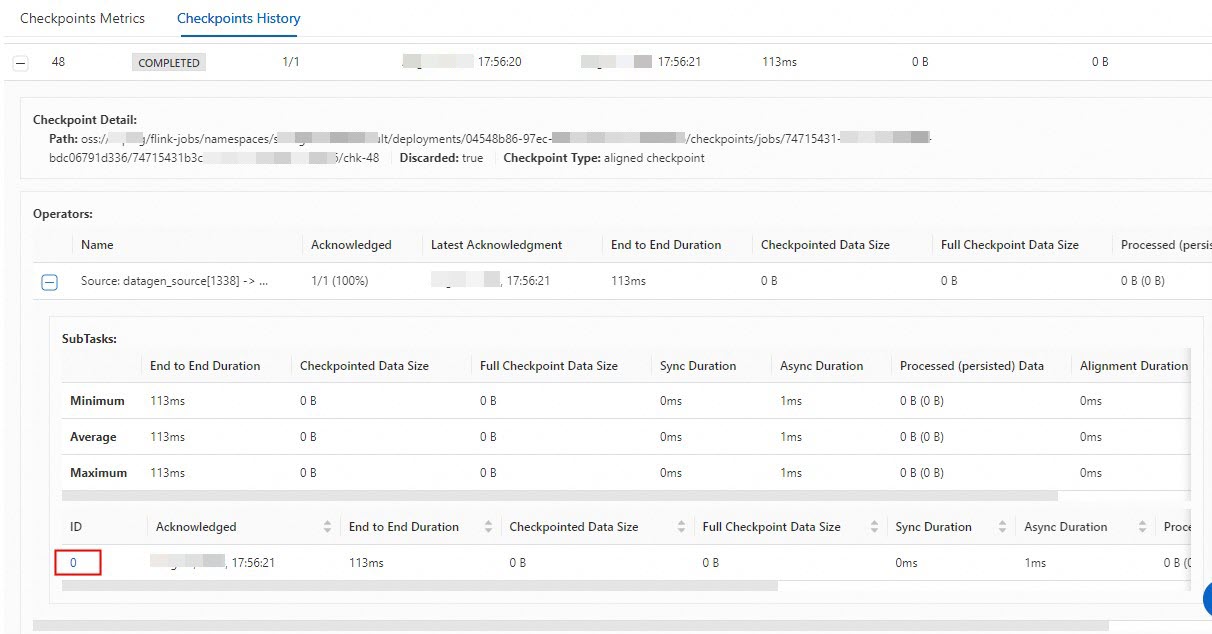
On the Running Task Managers tab, view the logs for the TaskManager running the slow task.