To create a map chart, such as a geo bubble map or a geomap, select dimension fields containing geographical information and change the dimension type from String to Location. Otherwise, the map cannot be displayed.
- Click Datasets to go to the Datasets page.
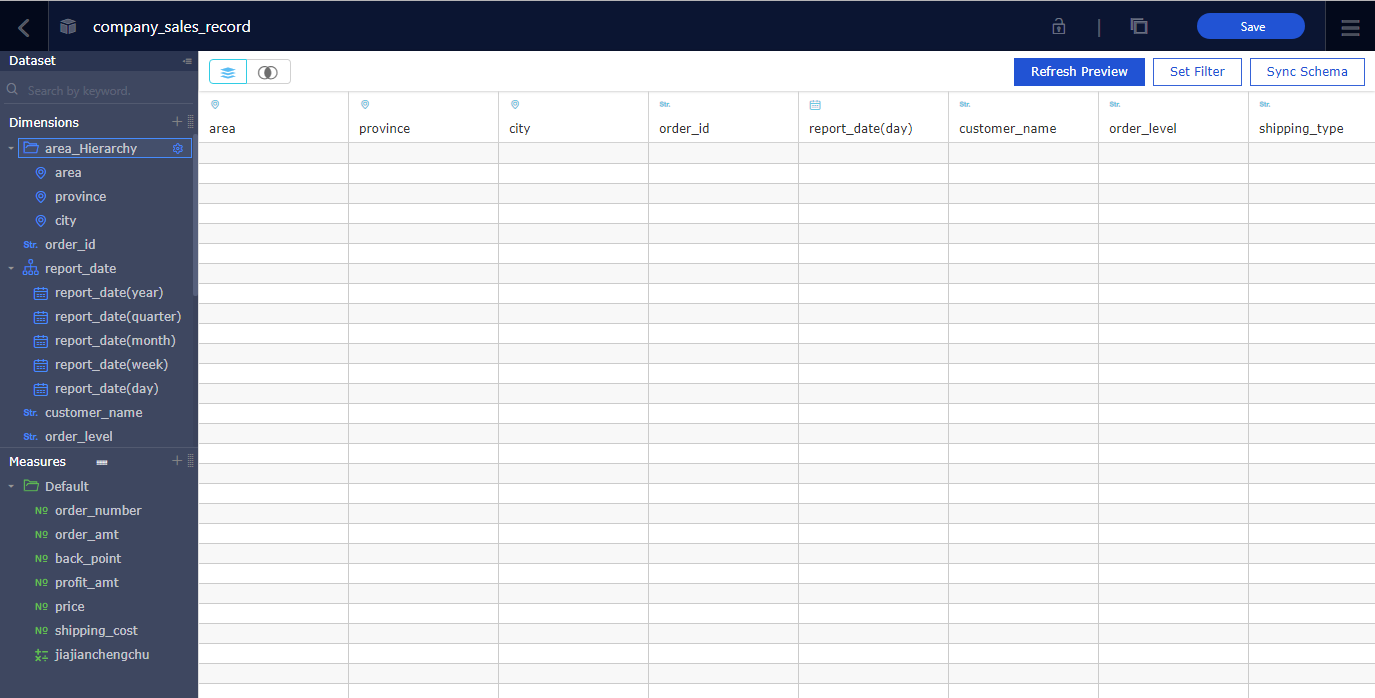
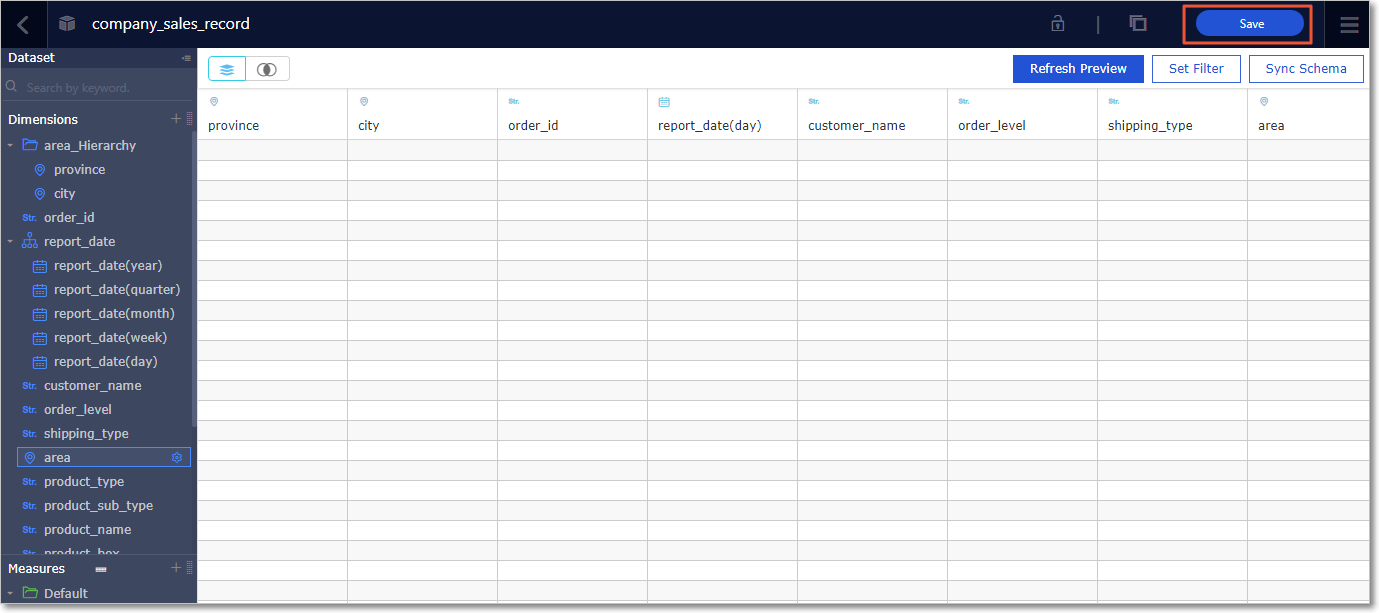
- Select a target dataset, for example, company_sales_record, and click Edit to go to
the dataset editing page, as shown in the following figure.
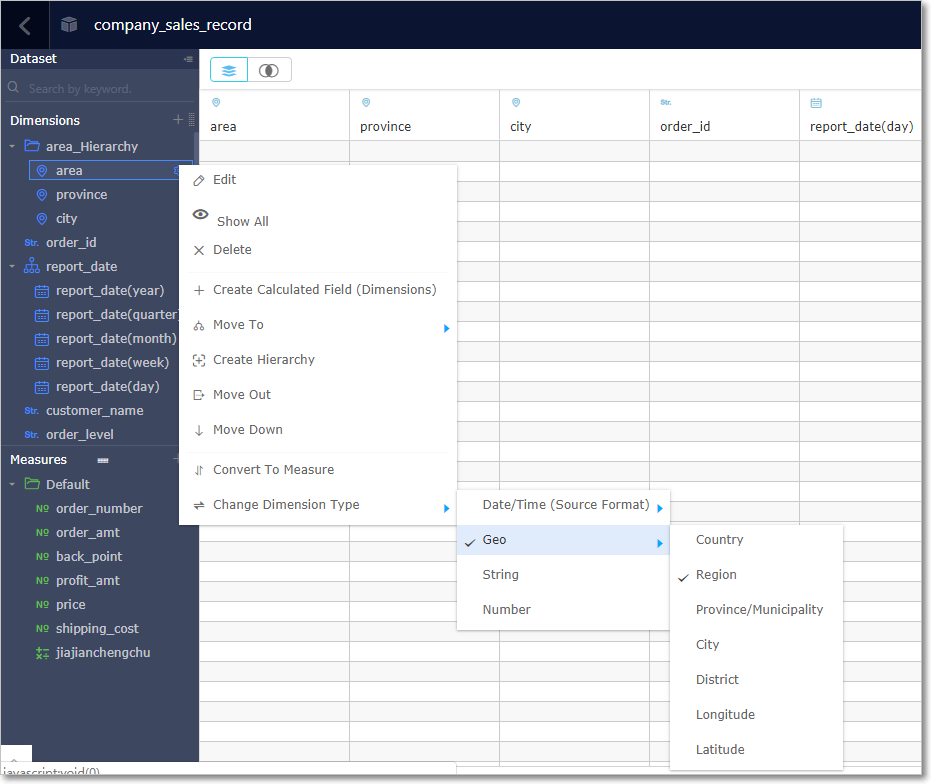
- In the dimension list, locate the area option.
- Right-click the dimension and choose , as shown in the following figure.
Note When the dimension type is changed to geographical information, the selected geographical information must match with the field. For example, if the field is area, you must select Region in the geographical information list. Otherwise, the dimension type cannot be changed.
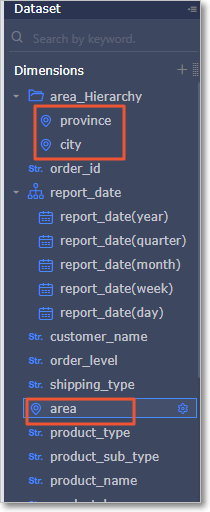
- You can change to Province/Municipality or City in the same way, as shown in the following
figure.
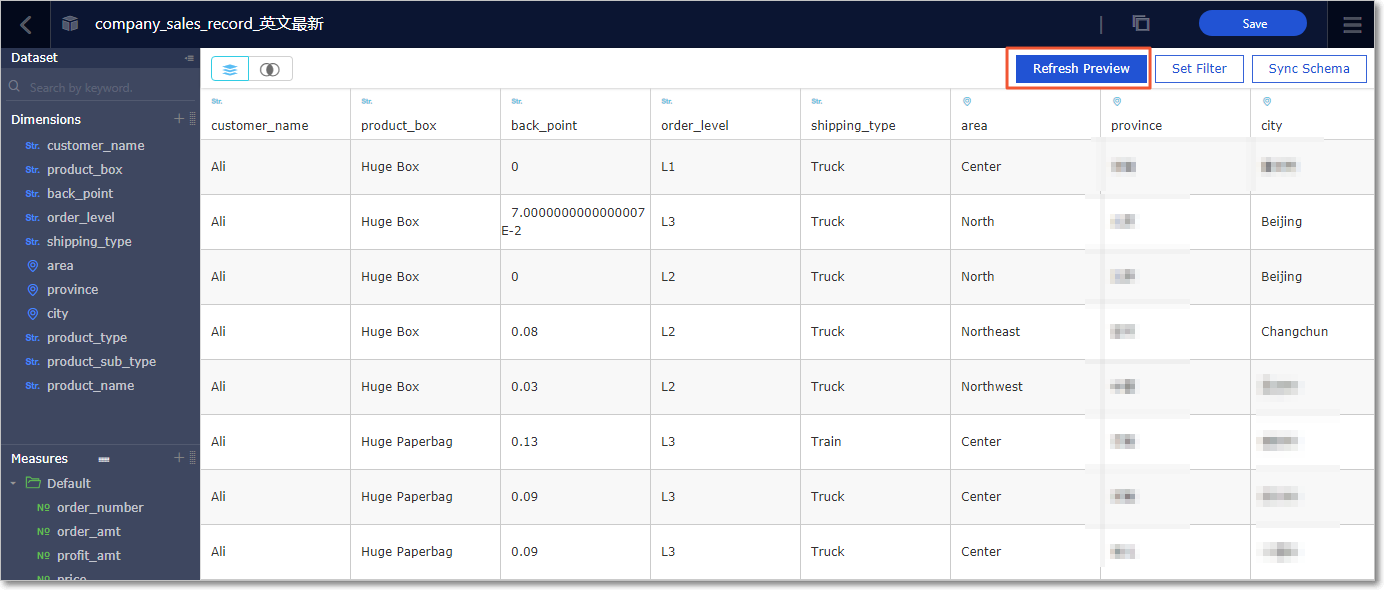
- After the dataset is edited, click Save, as shown in the following figure.
- Click Refresh Preview. The data is automatically displayed in the table, as shown in the following figure.