To better understand Quick BI custom visualization features, use the following basic concepts.
Component Structure
In Quick BI, custom components, custom menus, and custom pages are collectively referred to as custom visualization components. A custom visualization component consists of two main parts: lifecycle and metadata.
Lifecycle
The custom visualization lifecycle describes how a component, menu, or page renders at various stages. It is a JavaScript object that includes the following properties: bootstrap, mount, unmount, and update. Its interface is as follows:
interface Lifecycle {
  bootstrap?: LifecycleBootstrap;
  mount?: LifecycleMount;
  unmount?: LifecycleUnmount;
  update?: LifecycleUpdate;
}
Bootstrap
The bootstrap lifecycle runs when you access a Quick BI host page. Quick BI first pulls and registers the custom visualization component and then calls the bootstrap function. Its interface is:
type LifecycleBootstrap<T = LifecycleProps, P = any> = (props?: LifecycleProps<T>) => void | Promise<P>;Mount
The mount lifecycle runs when the custom visualization component renders for the first time. Quick BI calls the mount function. Its interface is:
type LifecycleMount<T = LifecycleProps, P = any> = (props?: LifecycleProps<T>) => void | Promise<P>;Unmount
The `unmount` lifecycle is triggered when a custom visualization component is removed. Quick BI calls the unmount function. The function interface is as follows:
type LifecycleUnmount<T = LifecycleProps, P = any> = (props?: LifecycleProps<T>) => void | Promise<P>;Update
The update lifecycle runs when the props of the custom visualization component change. Quick BI calls the update function. Its interface is:
type LifecycleUpdate<T = LifecycleProps, P = any> = (props?: LifecycleProps<T>) => void | Promise<P>;LifecycleProps
LifecycleProps defines the type of the props parameter passed to each lifecycle method of a custom visualization component. It includes two properties: container and customProps. The interface is defined as follows:
interface LifecycleProps {
  container?: HTMLElement;
  customProps?: CustomProps;
}
Container
container is a DOM element on the host page. The custom visualization component renders into this container. If Shadow DOM is enabled, the container’s parent becomes a ShadowRoot element.
CustomProps
customProps contains contextual information that the host page injects into the custom visualization component. Different visualization types accept different context types. For more information, see the sections for specific visualization types.
The following code provides a simple example of a custom visualization component lifecycle:
export {
  bootstrap: (props: LifecycleProps) => {},
  mount: (props: LifecycleProps) => {
    console.log(props); // { container: DOMObject, customProps: {} }
    props.container.textContent = `hello word`;
  },
  unmount: (props: LifecycleProps) => {},
  update: (props: LifecycleProps) => {
    props.container.textContent = `hello word updated`;
  },
}
Metadata
Custom visualization metadata is a JavaScript object that defines configuration settings outside of rendering. Different visualization types support different configurations. For example, you can use the metadata for a custom component to configure features such as the data panel, style panel, and advanced panel. For more information, see the sections on specific visualization types.
// Example of custom component metadata
export default {
  propsSchema: {
    // Data panel configuration
    dataSchema: {},
    // Style panel configuration
    styleSchema: {},
    // ...
  }
}
Host
A host page in Quick BI is any page that integrates a custom visualization component.
The same custom visualization component can be integrated into various host pages. For example, a "custom line chart" can appear on both a dashboard and a data dashboard.
A single host page can integrate the same custom visualization component only once, but it can create multiple instances of that component. For example, a dashboard can include multiple "custom line charts," each displaying distinct data from different datasets.
Asset Panel
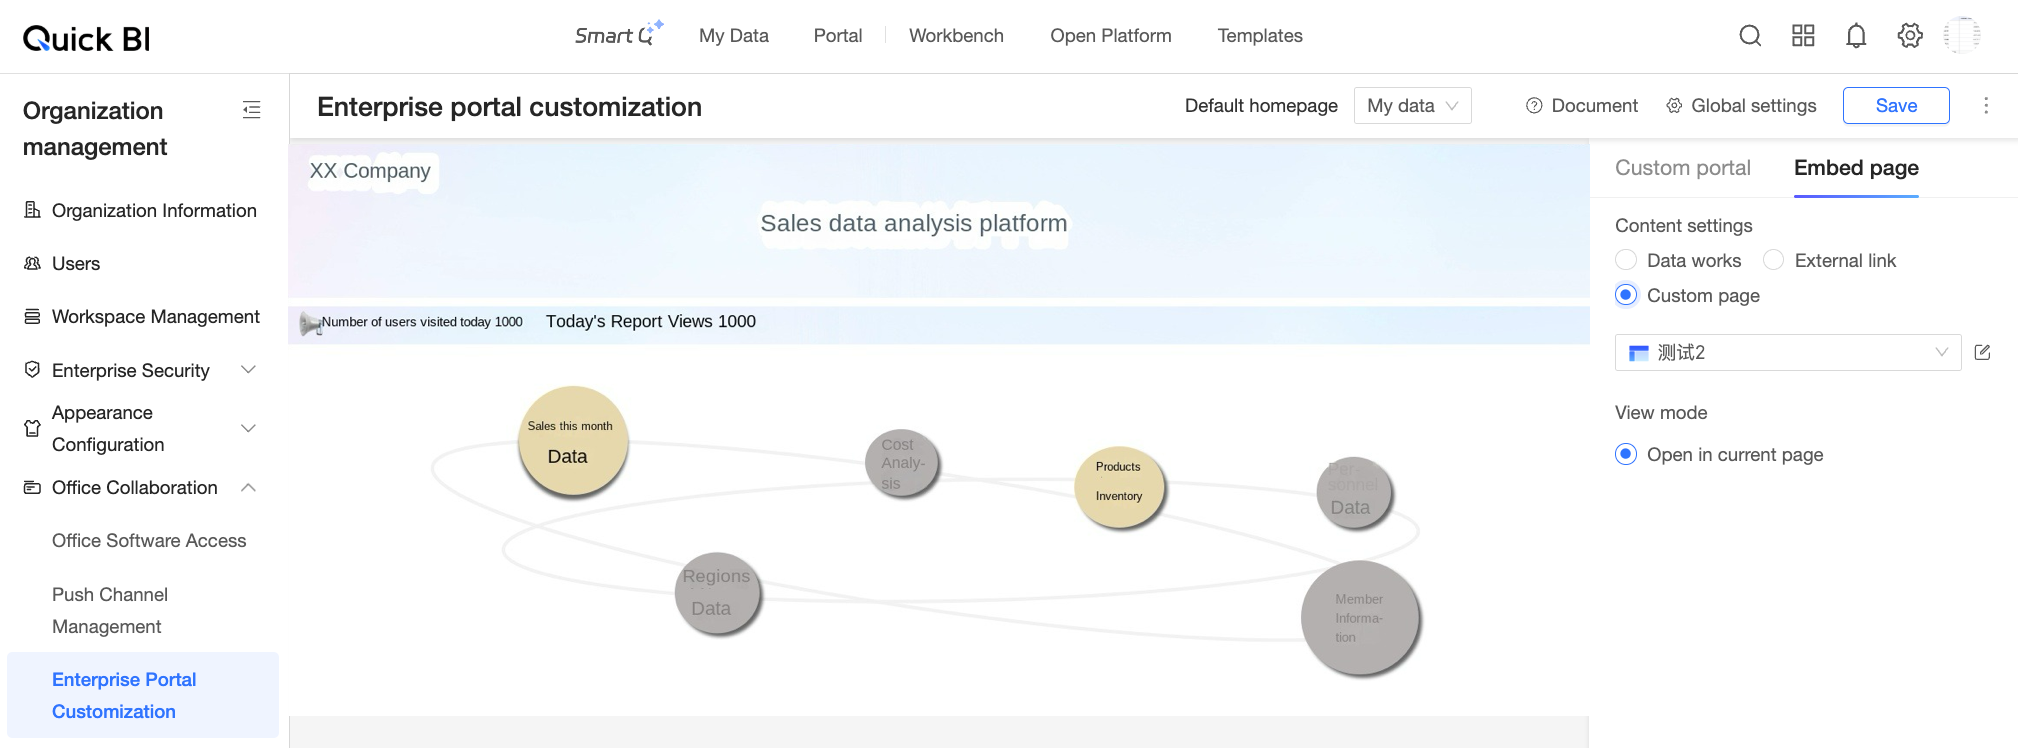
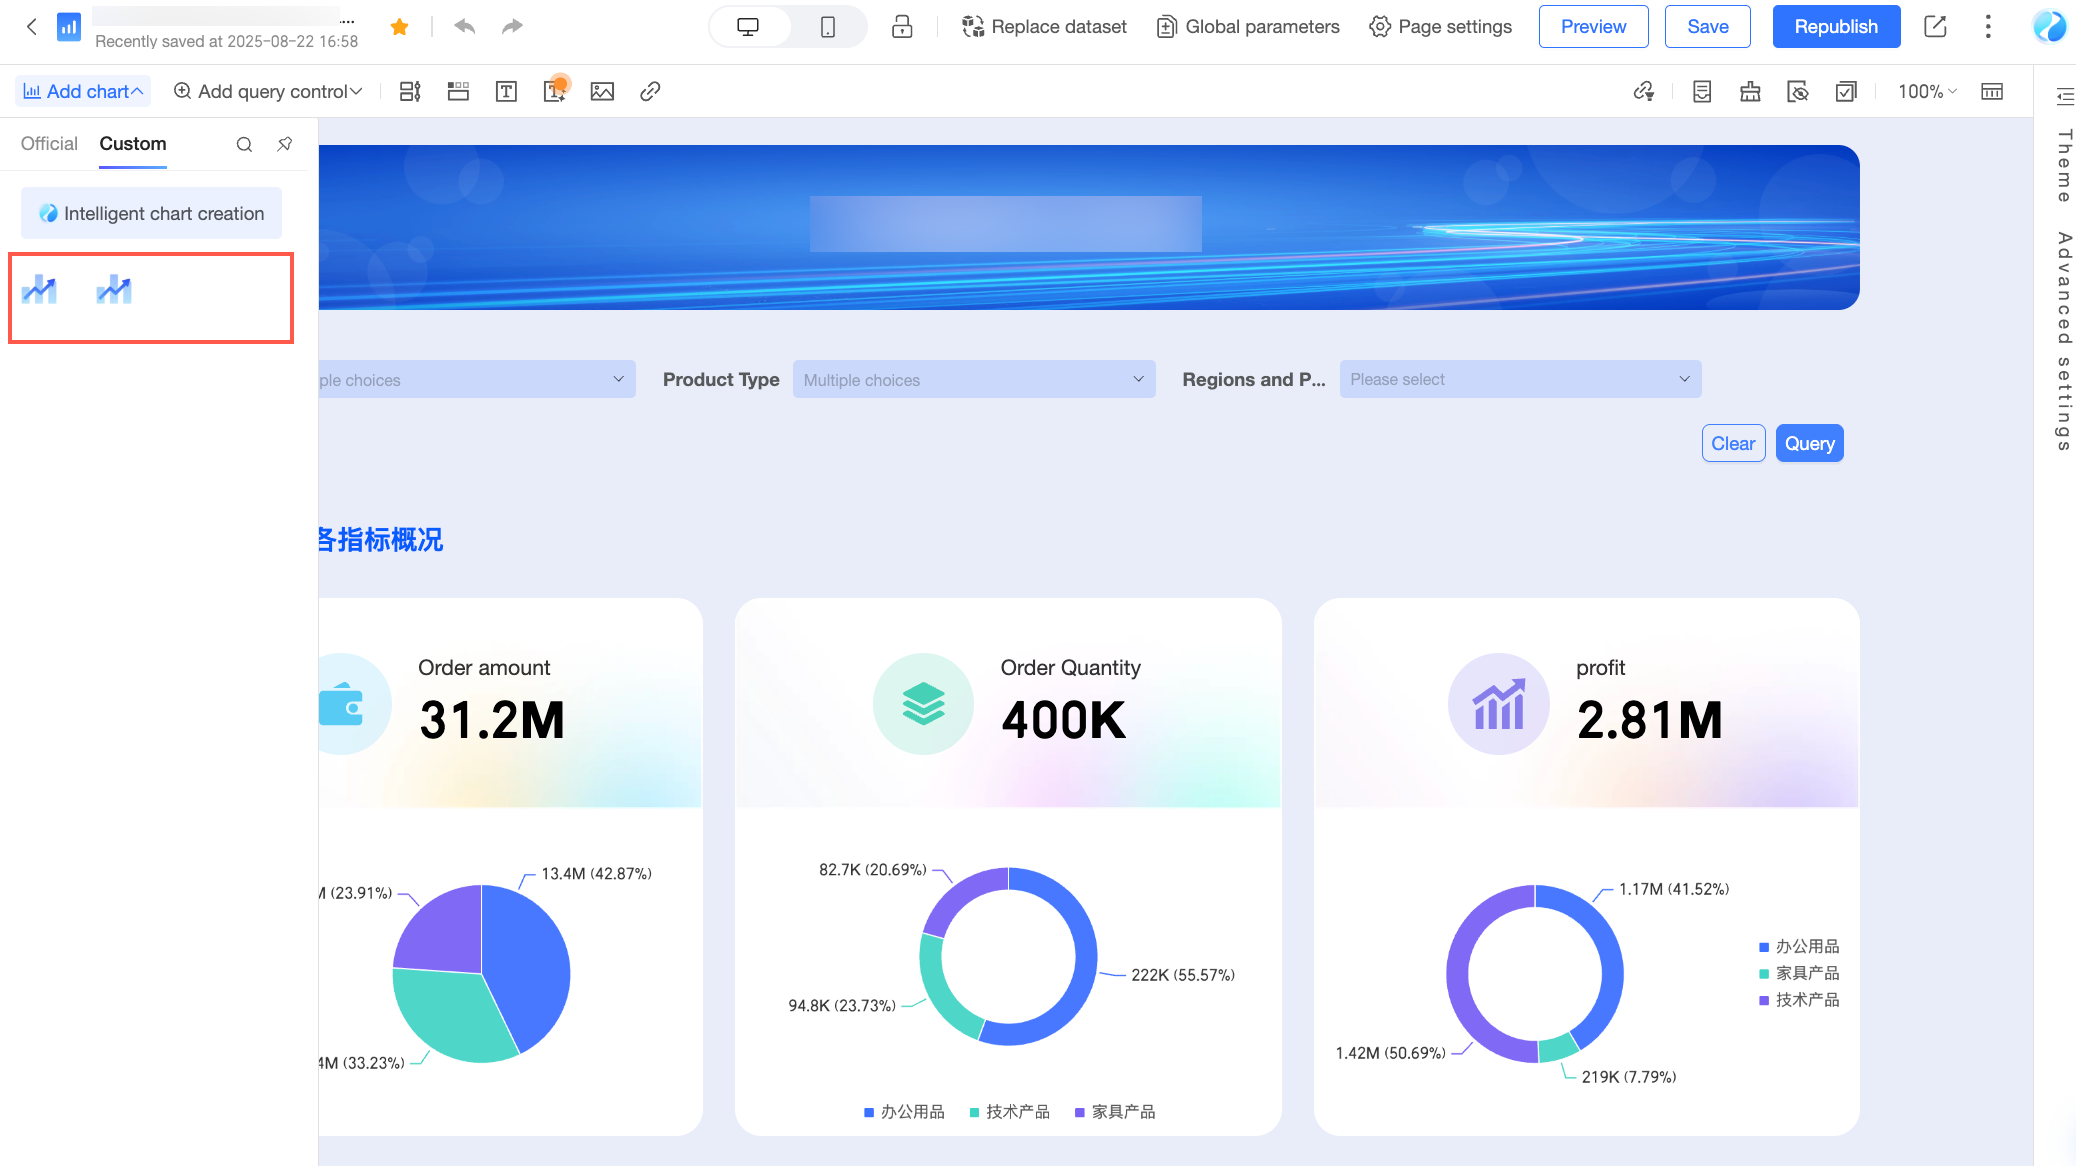
The asset panel is the entry point in a Quick BI host page where you configure custom visualization components. Examples include the dashboard editor page and the enterprise portal configuration page.
Dashboard asset panel
Enterprise portal asset panel