Managed Service for Prometheus actively pulls performance data from your Jenkins server based on the specified parameters. This way, you can monitor the server in real time and flexibly analyze the monitoring data. This topic describes how to monitor a Jenkins server.
Prerequisites
Prerequisites
Managed Service for Prometheus is activated. For more information, see Billing overview.
An Elastic Compute Service (ECS) instance is created. For more information, see Create and manage an ECS instance in the console (express version).
Alibaba Cloud Resource Center is activated. For more information, see Activate Resource Center.
Procedure
Log on to the Managed Service for Prometheus console. In the left-side navigation pane, click Integration Center.
Click Jenkins and set the parameters as prompted. The following table describes the key parameters.
Parameter
Description
Jenkins service address
The endpoint of the server.
Jenkins service username
The username of the server.
Jenkins service password
The password of the server.
Jenkins exporter listening port
The listening port number of the server.
metrics collection path
The path in which metric data is stored.
metrics collection interval (seconds)
The interval for collecting monitoring data. The default value is 15.
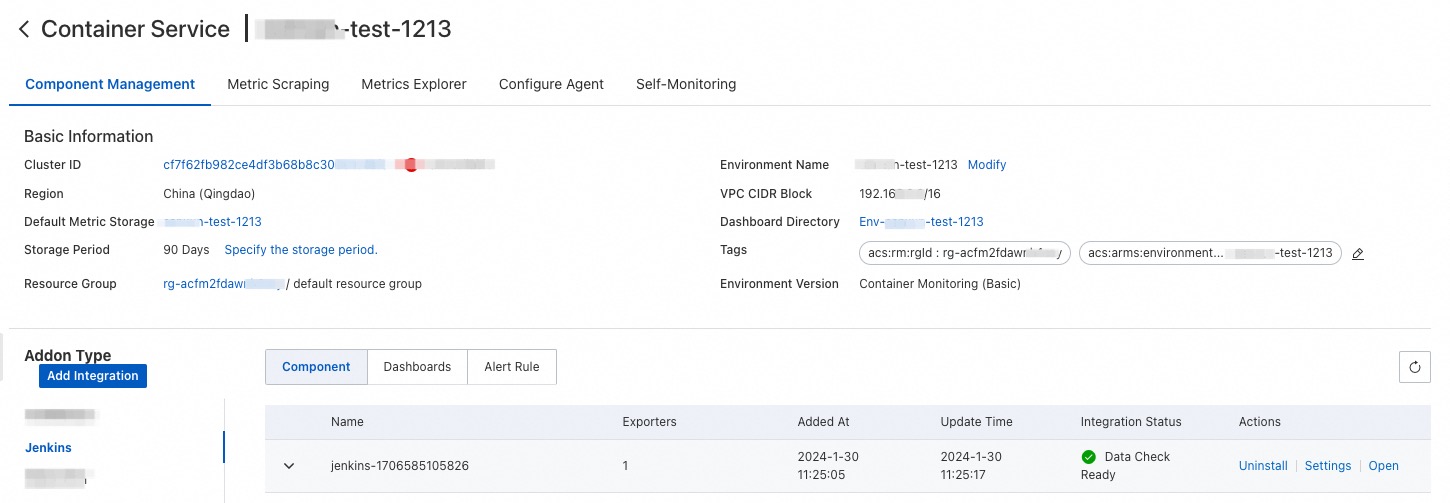
View and manage the monitoring data of the Jenkins server
The installed component is displayed on the Integration Management page in the Managed Service for Prometheus console. The Integration Management page consists of the Integrated Environments, Integrated Addons, and Query Dashboards tabs, where you can view information such as targets, metrics, dashboards, and alerts.