This topic describes how to configure recording rules and view the details of a recording rule metric.
Background information
Recording rules can be used for custom development of metric data. Some queries may require a large number of computations on the queried server, which increases workloads on the server. You can configure recording rules to advance the computing process to the server to which results are written. This reduces the resource usage on the queried server. In scenarios in which large-scale clusters are used and business is complex, recording rules can reduce the complexity of PromQL expressions. This improves the query performance and simplifies user configurations.
Configure recording rules
- Log on to the Prometheus console.
- In the upper-left corner of the page, select the region where the Prometheus instance resides. Then, click the name of the Prometheus instance.
- In the left-side navigation pane, click Settings. Click the Settings tab. Then, click Edit RecordingRule.yaml.
- In the Edit RecordingRule.yaml dialog box, delete the default configurations, enter the configurations of the recording rules, and then click Save. Note You need to configure only one RecordingRule.yaml file for a cluster. The names of rule groups must be unique.
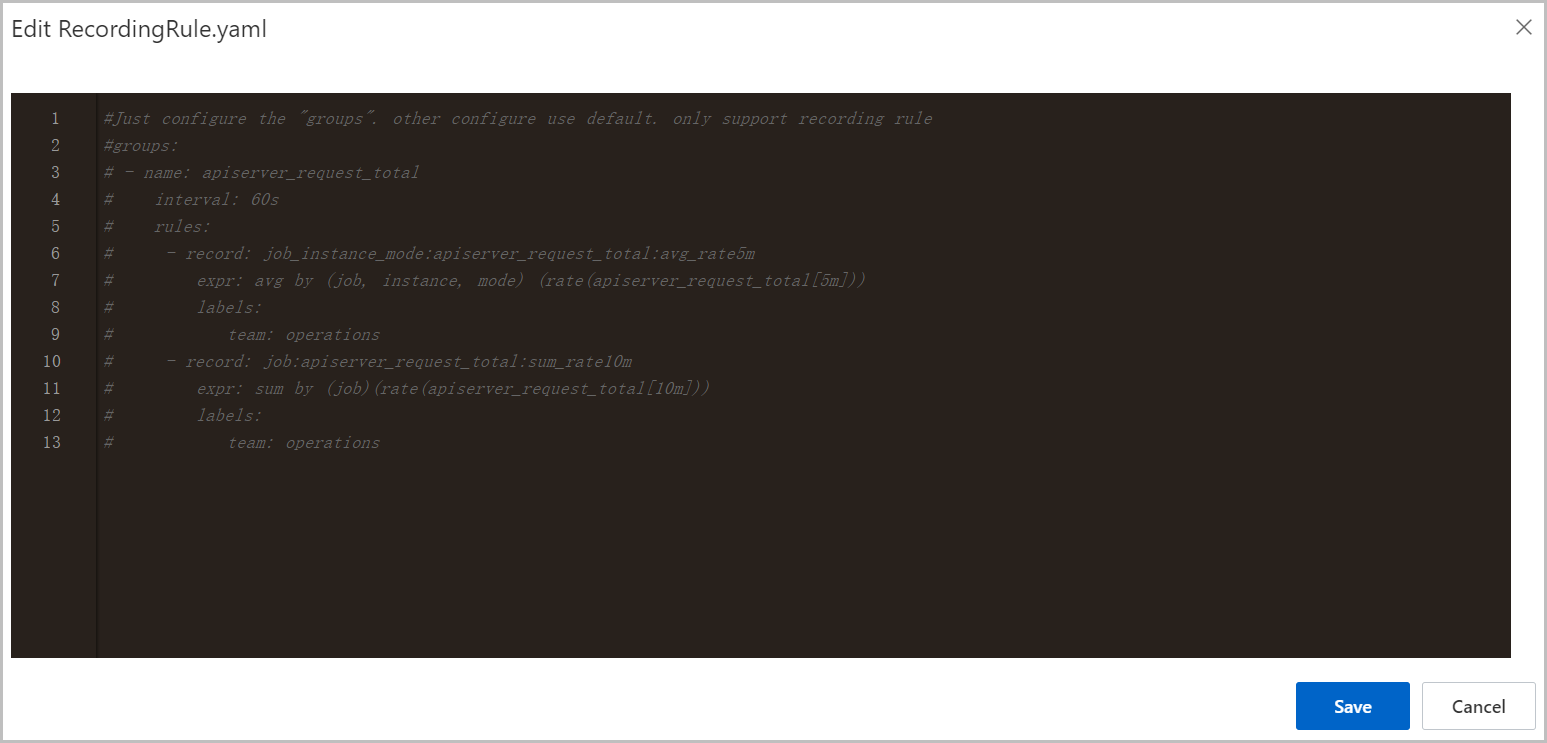
The following section provides an example of a rule group:
groups:
  - name: apiserver_request_total
    interval: 60s
    rules:
      - record: job_instance_mode:apiserver_request_total:avg_rate5m
        expr: avg by (job, instance, mode) (rate(apiserver_request_total[5m]))
        labels:
          team: operations
      - record: job:apiserver_request_total:sum_rate10m
        expr: sum by (job)(rate(apiserver_request_total[10m]))
        labels:
          team: operations
Parameter Description groups The rule groups. You can configure multiple rule groups in a RecordingRule.yaml file. name The name of the rule group. The names of rule groups must be unique. interval Optional. The interval at which the rule group is evaluated. The default value is 60. Unit: seconds. rules The recording rules. A rule group can contain multiple recording rules. record The name of the rule. The names of recording rules must be valid metric names. Note Recommended format for recording rule names:level:metric:operations.levelindicates the aggregation level and labels of the rule output.metricindicates the metric name.operationsis a list of operations that are applied to the metric. The latest operation is displayed first.
expr The expression. Managed Service for Prometheus calculates the metrics by using this expression. The expression must be a valid PromQL expression. lables Optional. The labels of the metric.
View the details of a recording rule metric
Method 1: Use the Grafana dashboard
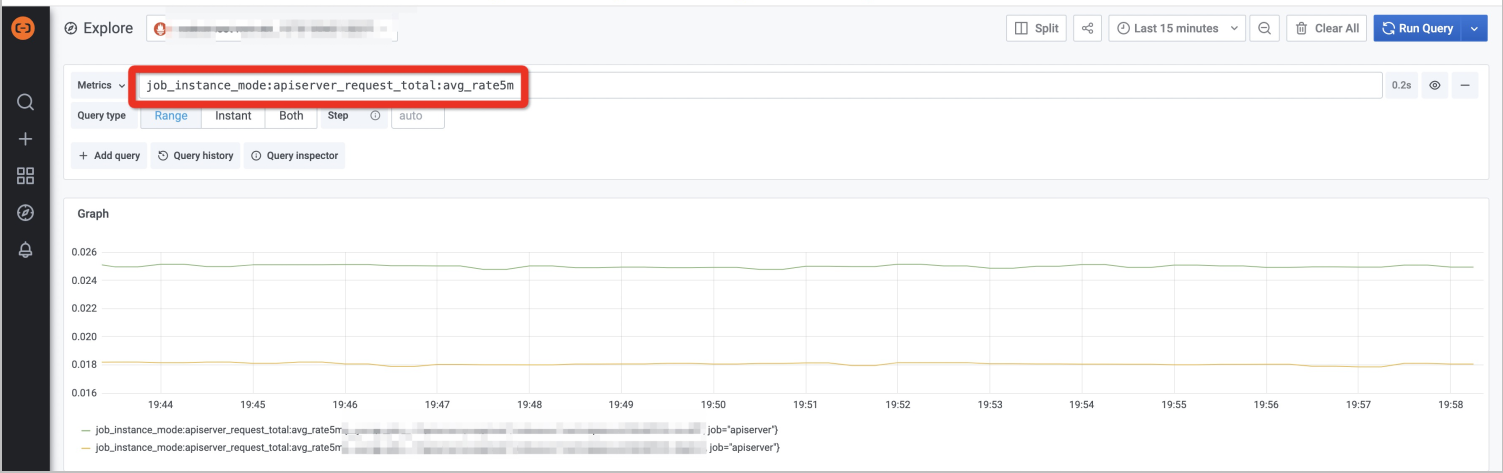
- Log on to the on-premises Grafana system as an administrator.
- In the left-side navigation pane, click Explore.
- On the Explore page, select the Kubernetes cluster name, and then enter the name of the recording rule metric in the text box next to Metrics. The details of the metric are displayed.
Method 2: Use the Managed Service for Prometheus console
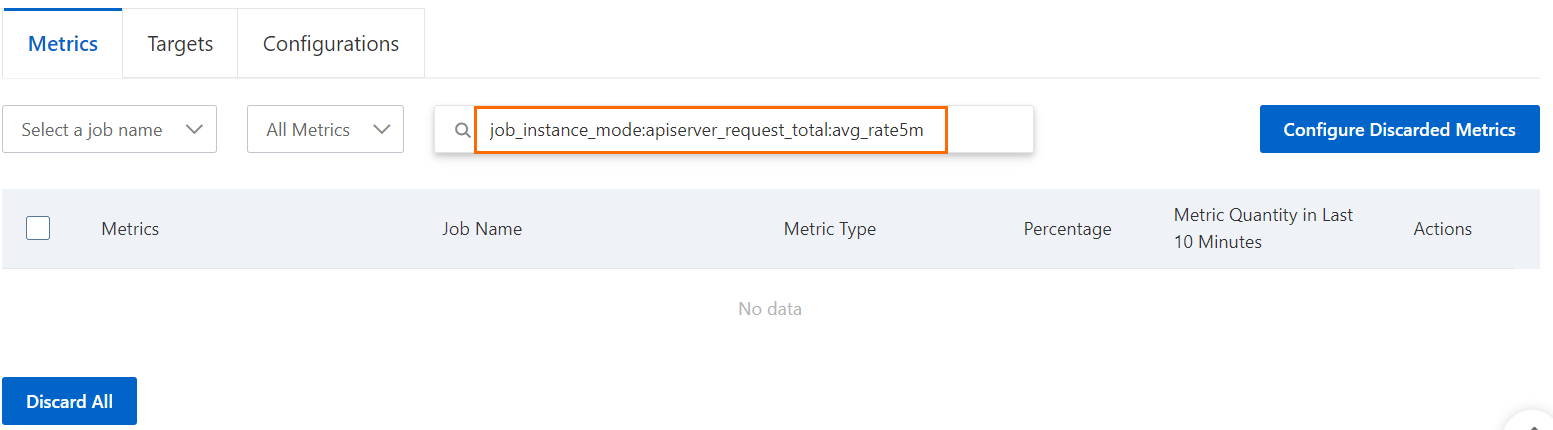
- Log on to the Prometheus console.
- In the upper-left corner of the page, select the region where the Prometheus instance resides. Then, click the name of the Prometheus instance.
- In the left-side navigation pane, click Service Discovery. Click the Metrics tab. Then, enter the name of a recording rule metric in the search box to view the details of the metric.
Configure remote write for recording rules
Alibaba Cloud Managed Service for Prometheus supports the remote write feature of open source Prometheus.
- Log on to the Prometheus console.
- In the upper-left corner of the page, select the region where the Prometheus instance for which you want to configure remote write resides. Then, click the name of the Prometheus instance.
- In the left-side navigation pane, click Settings. Click the Settings tab. Then, click Edit Prometheus.yaml.
- In the Edit Prometheus.yaml dialog box, configure remote write.
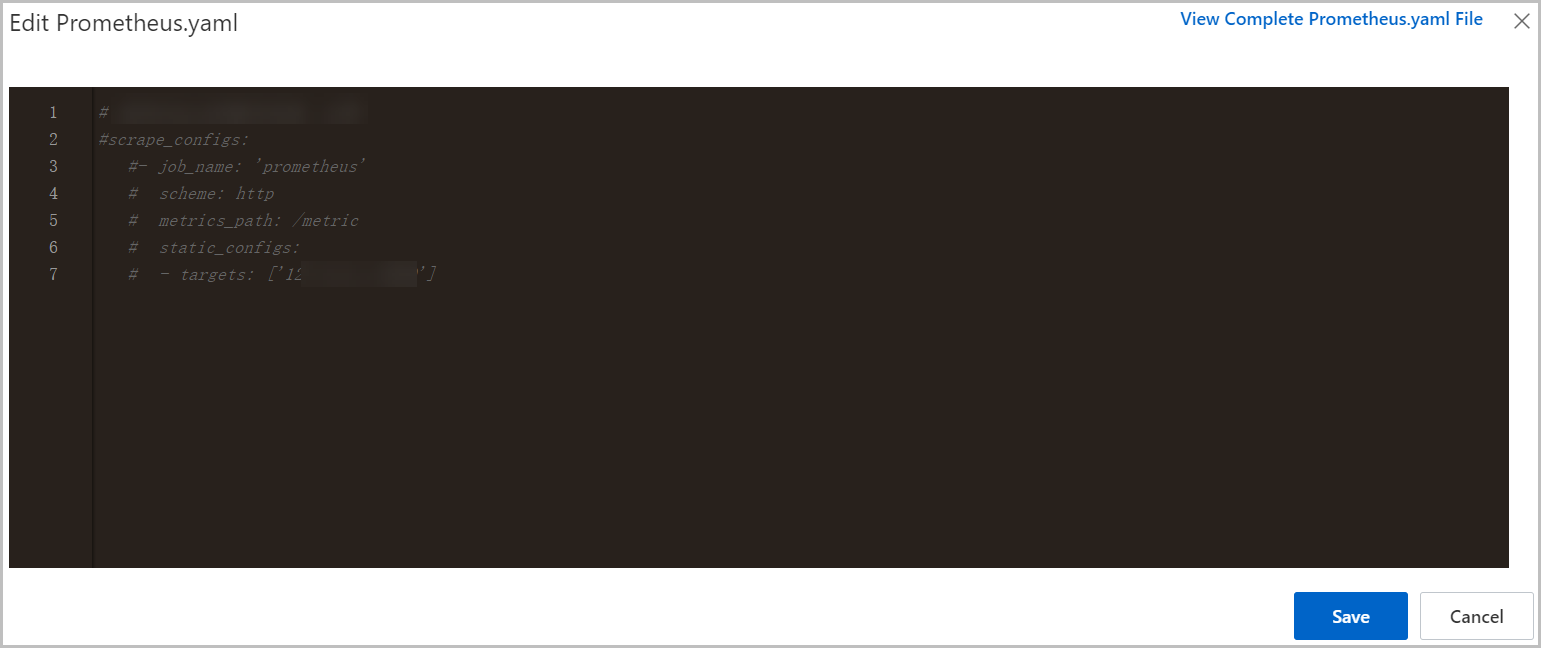 Note You can configure remote write in Alibaba Cloud Managed Service for Prometheus in the same manner as you configure remote write in open source Prometheus. You can specify an array of remote write configurations. In addition, you can specify write relabel configurations.The remote write configurations take effect on both the agent and the recording rules. If you need to remotely write only the metric data generated by recording rules to other databases, you can specify write relabel configurations. Example:
remote_write:
  - url: "https://xxxx/api/v1/prom/write?db=dbname&u=username&p=password"    //The endpoint of the database to which data is remotely written.
    write_relabel_configs:
      - source_labels: [__name__]
        regex: job_instance_mode:apiserver_request_total:avg_rate5m
        action: keep
Note In the preceding configuration, only data of the recording rule metric (job_instance_mode:apiserver_request_total:avg_rate5m) is remotely written to another database.
Related operations
To remotely write new metric data generated by recording rules, you must set the URL to a public endpoint. To configure a network whitelist for recording rules, you must add IP addresses based on the region.
 China (Beijing): 101.200.XX.XX
 China (Hangzhou): 118.31.XX.XX
 China (Shanghai): 106.14.XX.XX.XX
 China (Shenzhen): 8.129.XX.XX
 China (Zhangjiakou): 39.103.XX.XX
 China (Qingdao): 139.129.XX.XX
 China (Chengdu): 47.108.XX.XX
 China (Hong Kong): 47.242.XX.XX
 Singapore (Singapore): 47.241.XX.XX