Managed Service for Prometheus pulls performance metrics from Jenkins based on the integration parameters you configure. This lets you monitor the health of your build server in real time and analyze the collected data.
Prerequisites
-
Activate Managed Service for Prometheus. For more information, see Prometheus instance billing.
-
Create a Kubernetes cluster. For more information, see Create an ACK managed cluster.
-
Activate Alibaba Cloud Resource Center. For more information, see Activate Resource Center.
Procedure
Log on to the Managed Service for Prometheus console. In the left-side navigation pane, click Integration Center.
Click the Jenkins card and follow the on-screen instructions to complete the integration. The following table describes the key parameters.
Parameter
Description
Jenkins endpoint
The access endpoint of your Jenkins server.
Jenkins service username
The username for Jenkins.
Jenkins service password
The password for Jenkins.
Jenkins Exporter listening port
The port where the Jenkins Exporter exposes metrics.
metrics collection path
The path where metrics are exposed for collection.
metrics collection interval (seconds)
The interval for collecting monitoring data. The default value is 15.
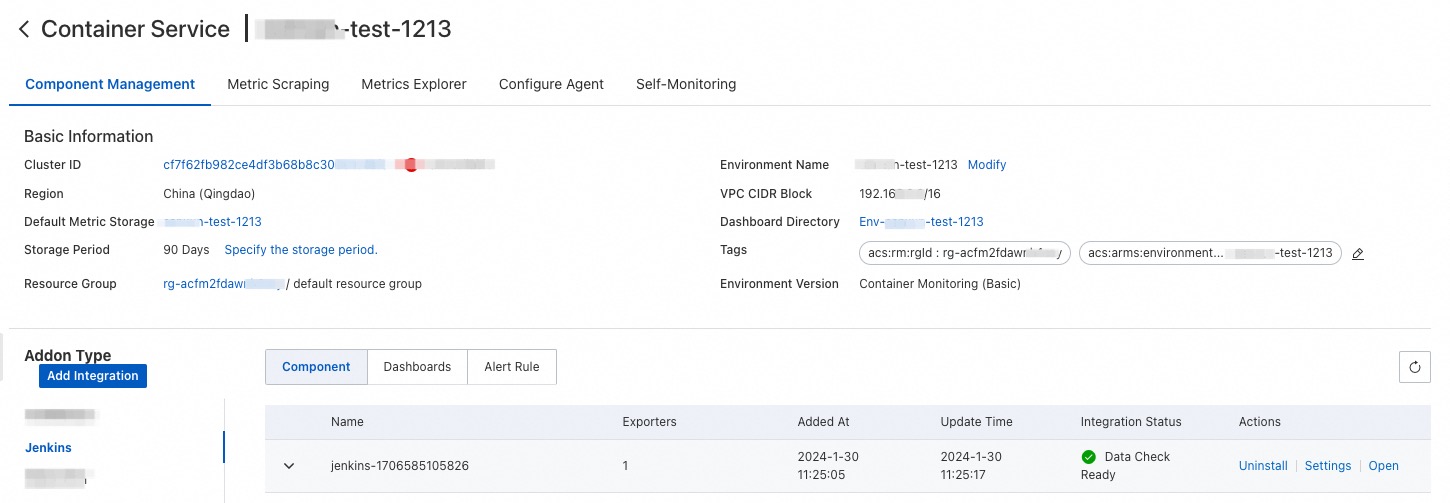
Jenkins status
The installed component is displayed on the Integration Management page in the Managed Service for Prometheus console. The Integration Management page consists of the Integrated Environments, Integrated Addons, and Query Dashboards tabs, where you can view information such as targets, metrics, dashboards, and alerts.