You can use the custom authentication provided by Alibaba Cloud Managed Service for Prometheus to aggregate the data of multiple Prometheus instances that are owned by different Alibaba Cloud accounts. This way, you can monitor Prometheus instance metrics, visualize them in Grafana dashboards, and configure alerting for them in a unified manner.
Background information
Generally, creating multiple Alibaba Cloud accounts for an enterprise increases the complexity of O&M. Managed Service for Prometheus provides global aggregation instances to help you centrally manage monitoring data across Alibaba Cloud accounts. This allows you to query and manage alerts, and implement O&M for multiple accounts in a unified manner.
Limitations
Global aggregation instances cannot be managed across super regions. The super regions are Asia Pacific China, Asia Pacific China HMT, Asia Pacific Others, Middle East, Europe, North America, and South America.
Managed Service for Prometheus V2 instances do not support cross-account features.
Prerequisites
Two Alibaba Cloud accounts (Account A and Account B) are created. Account A and Account B have been used to activate Managed Service for Prometheus. For more information, see Billing.
Prometheus instances are created with Account A and Account B. For more information, see Use the integration center to integrate data.
Usage notes
This topic uses Account A and Account B as an example to describe how to use a global aggregation instance to aggregate the data of multiple Prometheus instances. This way, you can use Account A to query the monitoring data of two accounts, and manage alerts rules for them.
Step 1: Create a global aggregation instance
Managed Service for Prometheus allows you to aggregate data by using one of the following methods:
Method 1: Use a resource directory
The multi-account architecture of your enterprise is built by using a resource directory. For more information about resource directories, see Resource Directory overview.
Set a delegated administrator for the trusted service in one of the following ways.
Method 1
Log on to the Resource Management console by using the management account of your resource directory.
In the left-side navigation pane, choose .
On the Trusted Services page, find the trusted service for which you want to add a delegated administrator account, and click Manage in the Actions column.
In the Delegated Administrator Accounts section, click Add and configure the Alibaba Cloud account with which you want to create a global aggregation instance as a delegated administrator.
NoteIn this topic, Account A is configured as a delegated administrator.
Click OK.
Then, you can use the delegated administrator account to access the multi-account management module of the trusted service and perform administrative operations within the resource directory.
Method 2
Use the management account of your resource directory or a RAM role that has administrator permissions to call the RegisterDelegatedAdministrator operation in OpenAPI Explorer to configure the Alibaba Cloud account with which you want to create a global aggregation instance as a delegated administrator. Specify the following parameters.
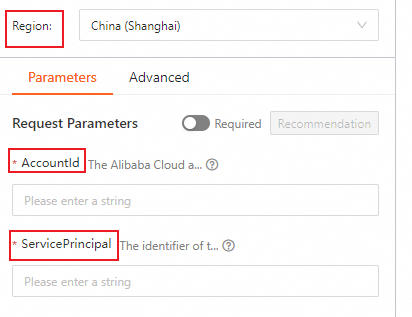
Parameter
Description
Region
Chinese mainland: Select China (Shanghai).
Other regions: Select Singapore.
AccountId
Enter the ID of the Alibaba Cloud account with which you want to create a global aggregation instance. In this topic, Account A is configured as a delegated administrator.
ServicePrincipal
Enter prometheus.aliyuncs.com.
Click Initiate Call.
Aggregate data.
Use Account A to log on to the Managed Service for Prometheus console.
In the left navigation pane, click Instances.
Click Create Prometheus Instance. On the Create Instance page, set the parameters as prompted and click Create.
Parameter
Description
Instance Type
Select Global Aggregation Instance.
Instance Name
Enter the name of the global aggregation instance.
Resource Group
Select a resource group.
Tags
Each tag is a case-sensitive key-value pair. You can add up to 20 tags.
Endpoint
Select the region where you want to configure alert rules. We recommend that you select the region with the largest number of Prometheus instances. Otherwise, the request duration and system stability may be affected.
Select the instances to be aggregated
Select Other Accounts (Resource Directory). Specify the Resource Directory Member Account parameter and select the Prometheus instance created with Account B.
NoteAfter you select Account B, Managed Service for Prometheus changes the status of the trusted service in the resource directory to Enabled.
You can select Prometheus instances in a different region to aggregate data across regions. First, you must set the Endpoint parameter to the desired region.
NoteTo modify the information of a global aggregate instance, click Edit in the Actions column. We recommend that you do not change the region after you create the global aggregation instance. Otherwise, the alert rules become invalid.
Method 2: Use a RAM role
Use Account B to create a RAM role.
Use Account B to log on to the Resource Access Management (RAM) console.
In the left-side navigation pane, choose .
On the Roles page, click Create Role.
On the Create Role page, set the Principal Type parameter to Cloud Account, specify an Alibaba Cloud account, and then click OK.
In the Configure Role step, set RAM Role Name to
AliyunPrometheusQueryRoleand set Select Trusted Alibaba Cloud Account to Other Alibaba Cloud Account, enter the ID of Account A, and then click OK.Click the role. On the page that appears, click the Trust Policy tab, and then click Edit Trust Policy. In the editor, modify the trust policy to grant permissions to Account A.
 Note
NoteYou can enter an array of Alibaba Cloud accounts in the trust policy to grant permissions to them.
Attach the
AliyunRAMReadOnlyAccessandAliyunARMSReadOnlyAccesspolicies toAliyunPrometheusQueryRole.In the left-side navigation pane, choose Identities > Roles. On the Roles page, find the role and click Grant Permission in the Actions column.
In the Policy section of the Grant Permission panel, search for the
AliyunRAMReadOnlyAccessandAliyunARMSReadOnlyAccesspolicies in the search box, select them, and click Grant permissions.
(Optional) Create a RAM user for Account A.
NoteIf you want to aggregate Prometheus instance data from Account B into Account A, you need to create a RAM user for Account A.
If you want to aggregate Prometheus instance data from Account B into an existing RAM user of Account A, proceed to the next step.
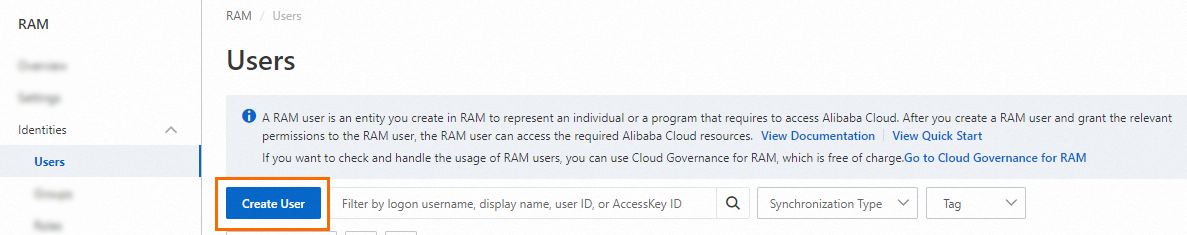
Use Account A to log on to the RAM console.
In the left-side navigation pane, choose .
On the Users page, click Create User.
On the Create User page, set the following parameters:
Logon Name: The logon name can be up to 64 characters in length, and can contain letters, digits, periods (.), hyphens (-), and underscores (_).
Display Name: The display name can be up to 128 characters in length.
NoteYou can click Add User to create multiple RAM users at a time.
Access Mode: To ensure the security of your Alibaba Cloud account, we recommend that you select only one access mode for the RAM user. This way, the RAM user for an individual is separated from the RAM user for a program.
Console Access
If the RAM user represents an individual, we recommend that you select Console Access for the RAM user. This way, the RAM user can use a username and password to access Alibaba Cloud. If you select Console Access, you must configure the following parameters:
Set Console Password: You can select Automatically Regenerate Default Password or Reset Custom Password. If you select Reset Custom Password, you must specify a password. The password must meet the complexity requirements. For more information, see Configure a password policy for RAM users.
Password Reset: specifies whether the RAM user is required to reset the password upon the next logon.
Enable MAF: specifies whether to enable multi-factor authentication (MFA) for the RAM user. After you enable MFA, you must bind an MFA device to the RAM user. For more information, see Bind an MFA device to a RAM user.
Using permanent AccessKey to access
If the RAM user represents a program, you can select Using permanent AccessKey to access for the RAM user. This way, the RAM user can use an AccessKey pair to access Alibaba Cloud. If you select OpenAPI Access, the system automatically generates an AccessKey ID and AccessKey secret for the RAM user. For more information, see Obtain an AccessKey pair.
ImportantAn AccessKey secret for a RAM user is displayed only when you create an AccessKey pair. You cannot query the AccessKey secret in subsequent operations. Therefore, you must back up your AccessKey secret.
An AccessKey pair is a permanent credential for application access. If the AccessKey pair of an Alibaba Cloud account is leaked, the resources that belong to the account are exposed to potential risks. To prevent credential leak risks, we recommend that you use Security Token Service (STS) tokens. For more information, see Best practices for using an access credential to call API operations.
Click OK.
Complete security verification as prompted.
Grant permissions to the RAM user.
Click the name of the RAM user. On the page that appears, click the Permissions tab.
Click Grant Permission. In the Policy section of the panel that appears, search for the
AliyunSTSAssumeRoleAccessandAliyunARMSFullAccesspolicies in the search box, add them to the right-side section, and then click Grant permissions.
Aggregate data.
Log on to the Managed Service for Prometheus console as the RAM user.
In the left-side navigation pane, click Instances.
Find the global aggregation instance and click Edit in the Actions column. In the Select the instances to be aggregated section in STEP3, select Other Accounts (Custom Authentication).
In the search box next to Alibaba Cloud Account, enter the ID of Account B in the search box and click OK. The system displays all Prometheus instances that belong to Account B. Select Prometheus instances and click Edit Aggregate Instance.
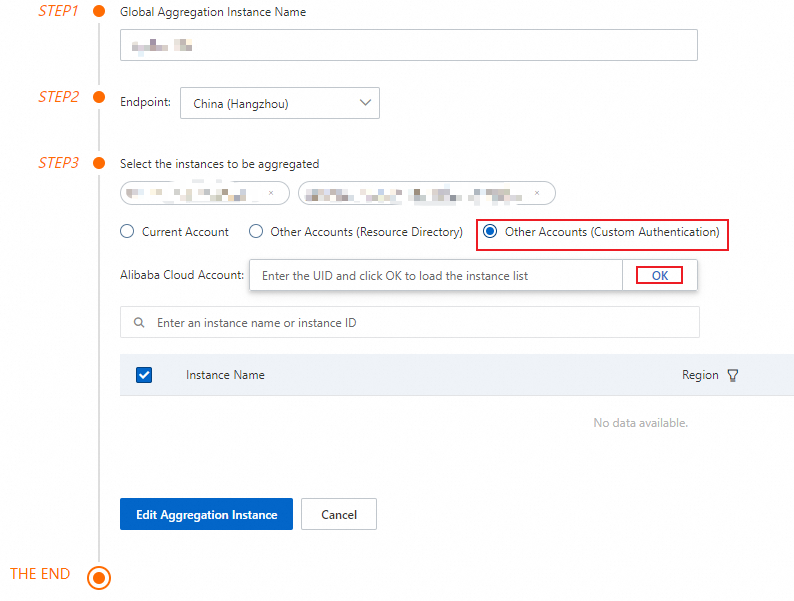 Note
NoteOnly RAM users that have permissions on another Alibaba Cloud account can modify the Prometheus instances within the account, whereas the Alibaba Cloud account that owns the RAM users cannot.
Step 2: Query data of the global aggregation instance
After you create the global aggregation instance, you can view the performance metric data of the global aggregation instance in built-in Grafana dashboards.
On the Instances page, click the name of the global aggregation instance. In the left-side navigation pane, click Dashboards.
Step 3: Create an alert rule for the global aggregation instance
On the Instances page, click the name of the global aggregation instance. In the left-side navigation pane, click Alert rules.
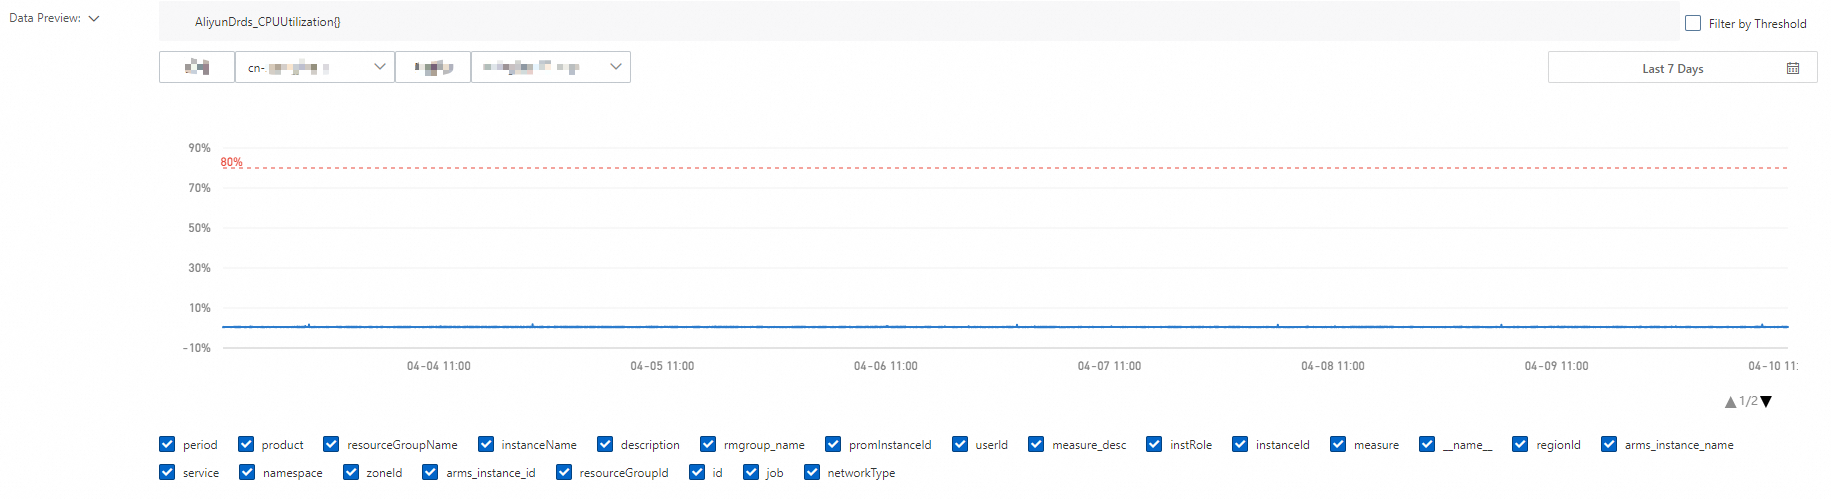
On the Prometheus Alert Rules page, click Create Prometheus Alert Rule and create an alert rule as prompted. For more information, see Create an alert rule for a Prometheus instance.
NoteIn the Data Preview section of the Create Prometheus Alert Rule page, the unique_cluster_id and unique_cluster_name of the global aggregation instance are displayed. This feature helps you identify the instances that trigger alerts.
More operations
Edit the global aggregation instance
On the Instances page, find the global aggregation instance and click Edit in the Actions column. If you change the Endpoint parameter, the alert rules configured in the current region become invalid. Therefore, we recommend that you do not change the Endpoint parameter unless it is necessary.
Uninstall the global aggregation instance
If you no longer use the global aggregation instance, you can uninstall the instance.
On the Instances page, find the Prometheus instance, and click Uninstall in the Actions column. In the message that appears, click OK. After the Prometheus instance is uninstalled, it is no longer displayed on the Instances page.
FAQs
Do global aggregation instances charge fees?
Global aggregation instances are in public preview free of charge.
Do global aggregation instances synchronize data from other Prometheus instances?
Global aggregation instances do not synchronize data from other Prometheus instances. Instead, they provide an entry for data query.