This topic describes how to use Managed Service for Prometheus to monitor Kubernetes events, view the dashboards, and configure alert rules. Event monitoring is a monitoring method provided by Kubernetes. It provides improvements over resource monitoring in terms of timeliness, accuracy, and scenarios. You can use node-problem-detector (NPD) with the Kubernetes event center of Simple Log Service to sink cluster events, and configure NPD to diagnose clusters and send error events to sinks. You can sink cluster events to DingTalk, Simple Log Service, and EventBridge. This allows you to monitor anomalies and issues in clusters in real time.
Prerequisites
Managed Service for Prometheus is activated. For more information, see Billing overview.
An ACK cluster is created. For more information, see Create an ACK managed cluster.
Alibaba Cloud Resource Center is activated. For more information, see Activate Resource Center.
Step 1: Configure Kubernetes events
Log on to the Managed Service for Prometheus console. In the left-side navigation pane, click Integration Center.
Click Kubernetes Event. In the panel that appears, select the ACK cluster, and then set the parameters as prompted.
NoteIntegration of Kubernetes events takes 1 to 2 minutes. Dashboard data is not available until integration is complete.
Step 2: View the dashboards
Managed Service for Prometheus provides multiple built-in dashboards, to show monitoring details, such as container overview, core components, nodes, and pods. You can view these dashboards in the Container Service for Kubernetes, Application Real-Time Monitoring Service, or Managed Service for Prometheus console. Perform the following steps to view the dashboards:
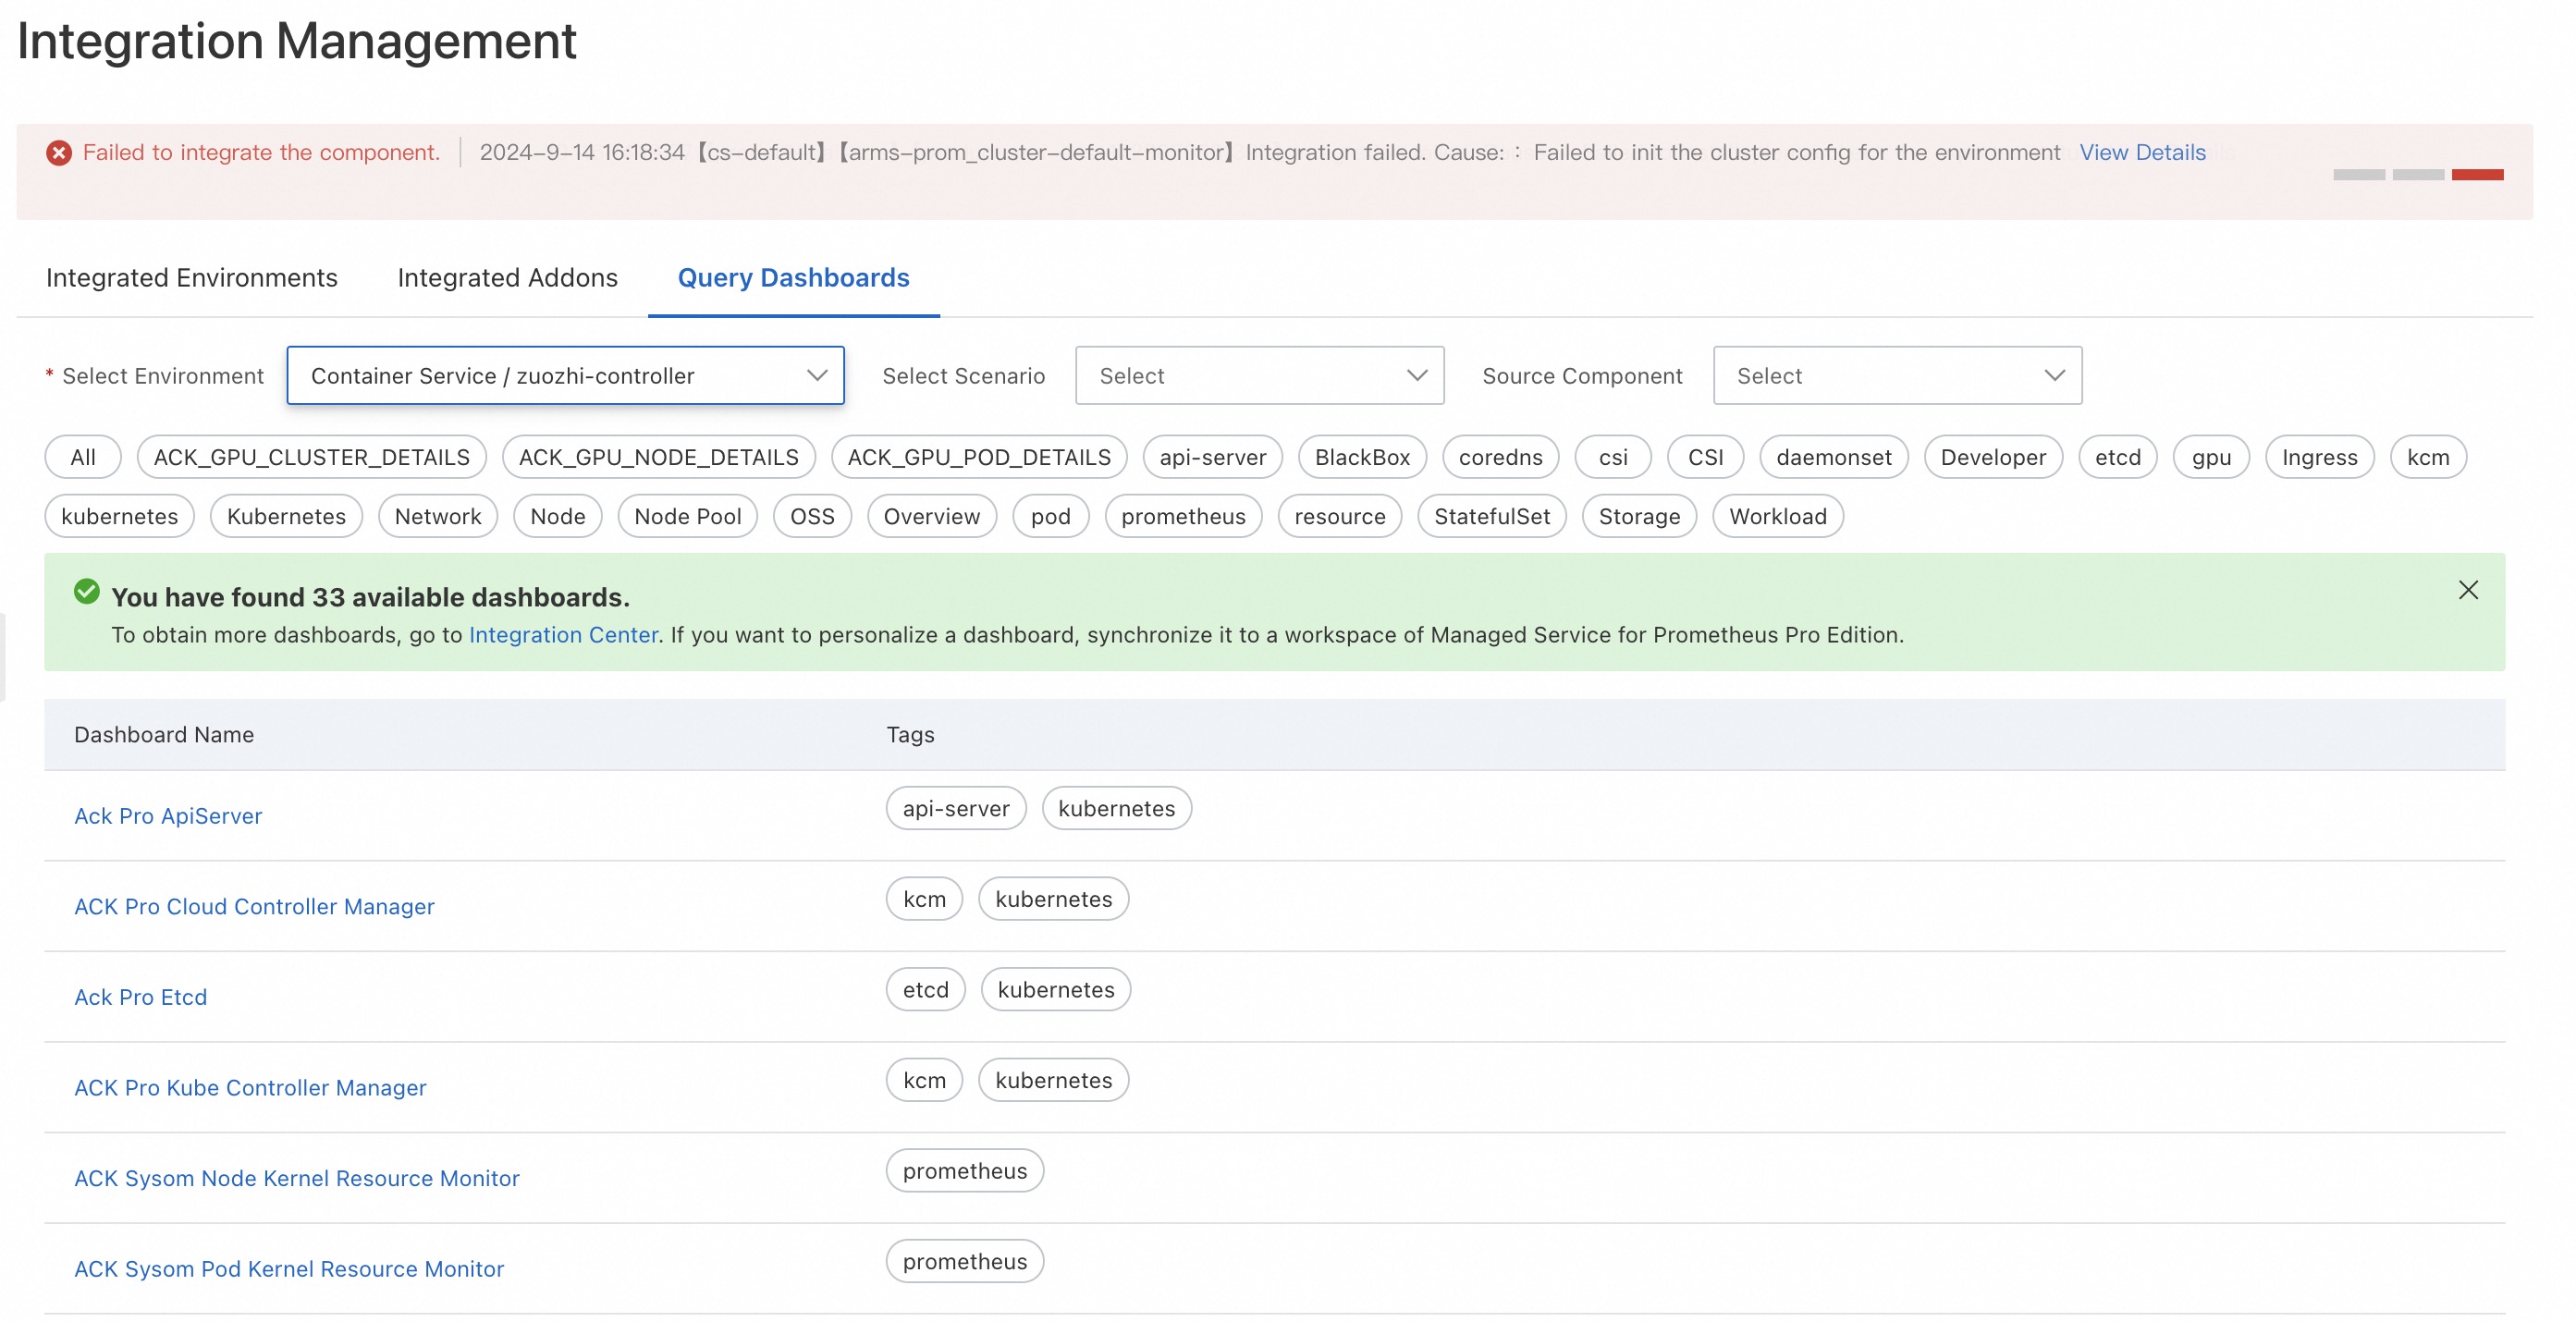
Log on to the Managed Service for Prometheus console. In the left-side navigation pane, click Integration Management.
On the Integration Management page, click the Query Dashboards tab. Select the container to view the dashboards.
Step 3: Configure alerting
Log on to the Managed Service for Prometheus console. In the left-side navigation pane, click Integration Management.
On the Integration Management page, click the Integrated Environments tab. On the Container Service tab, click the name of the ACK cluster.
On the Component Management tab, view the built-in alert rules in the Alert Rule section.
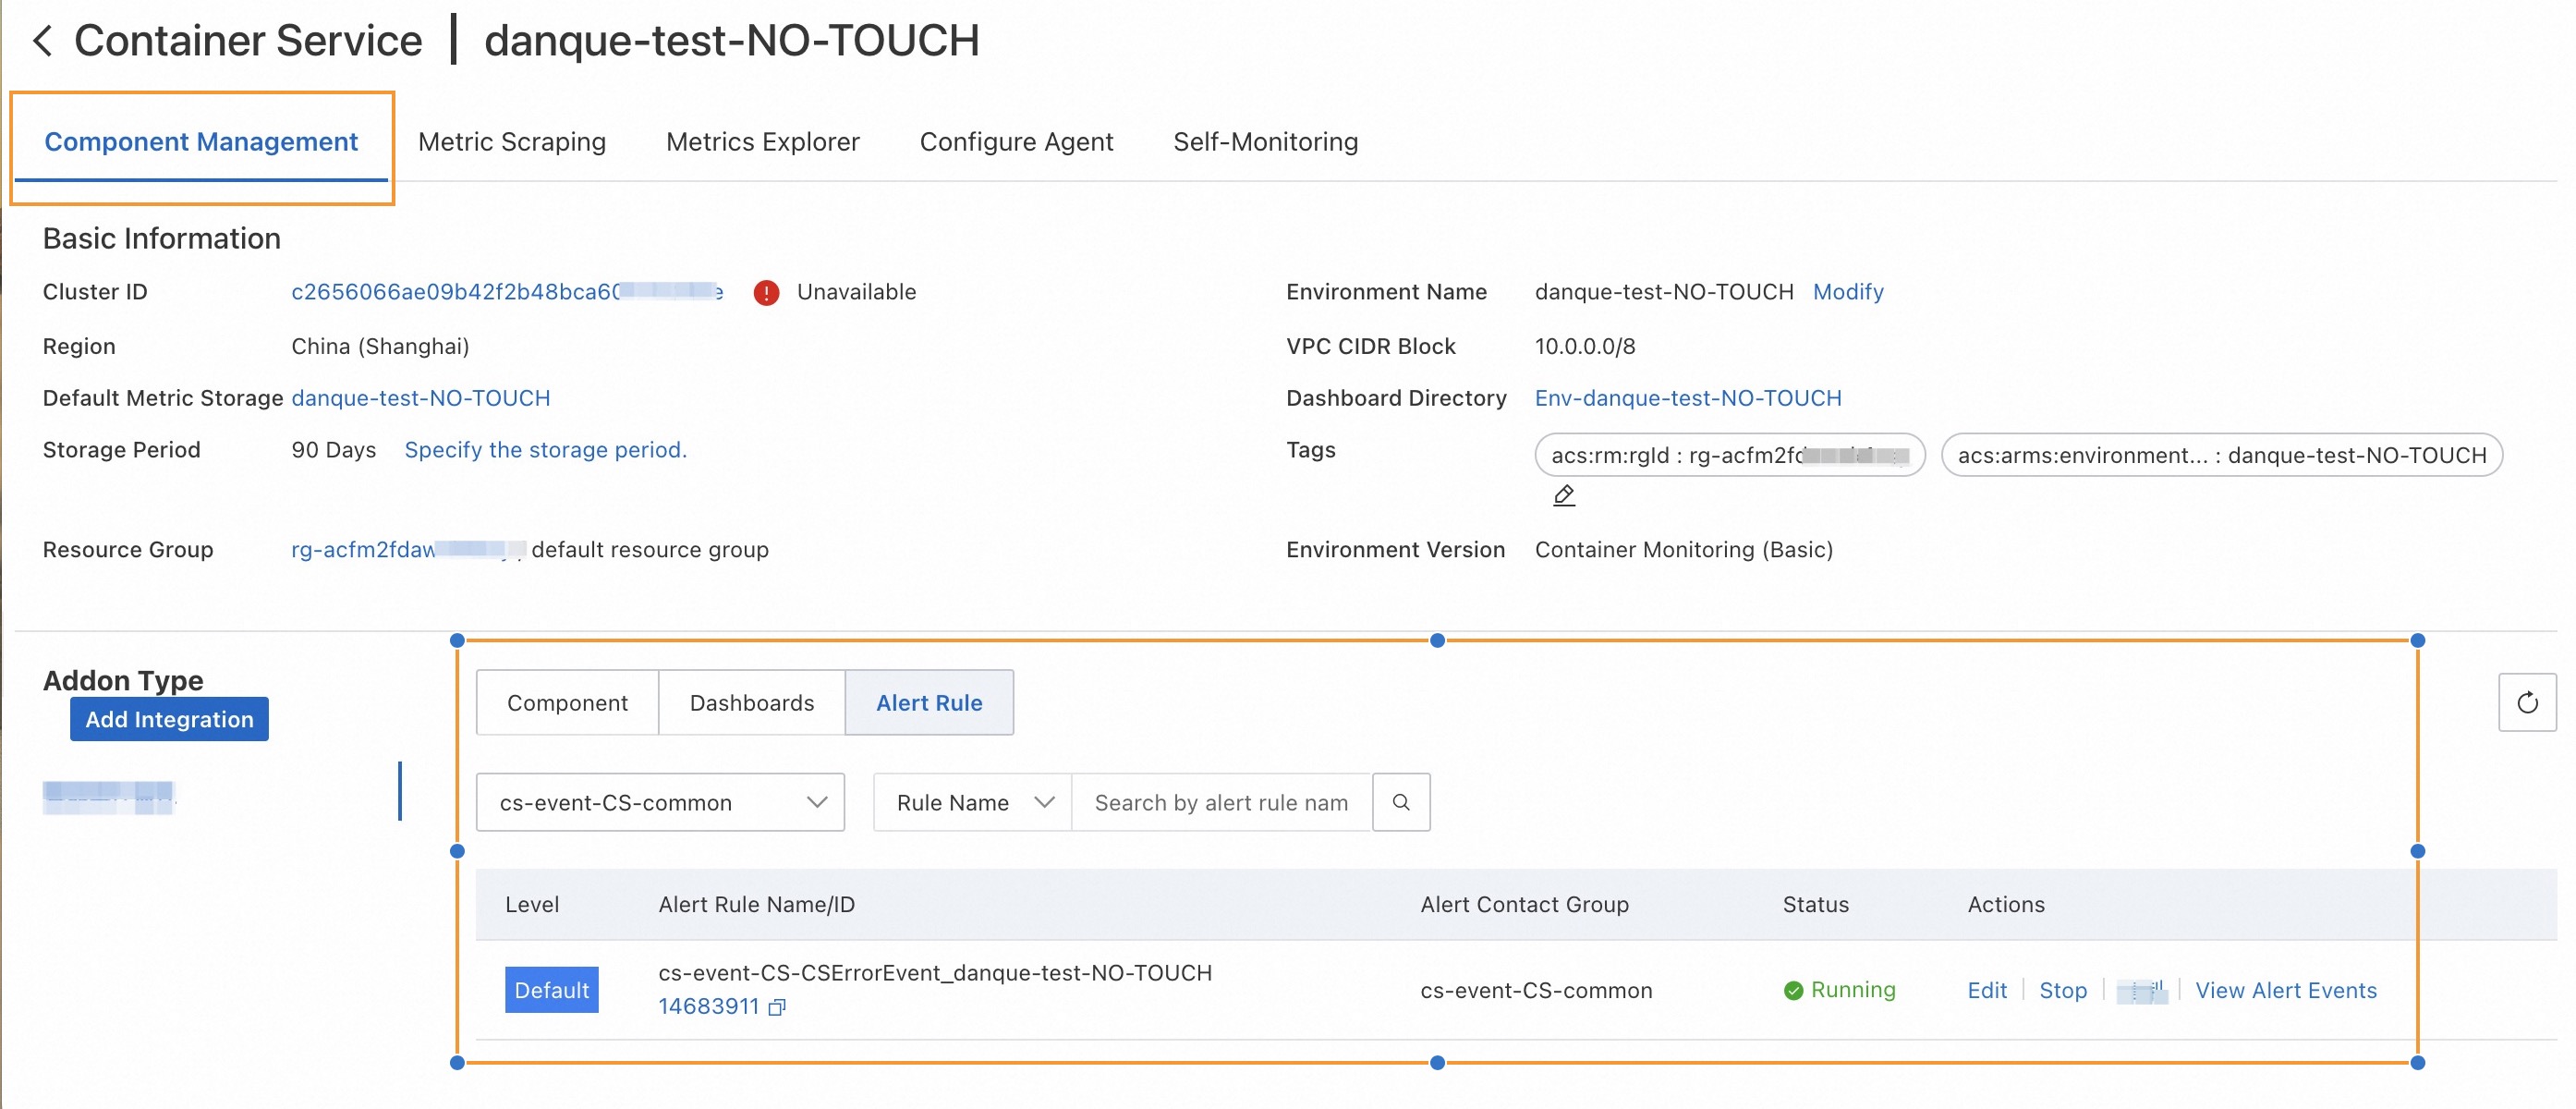
The built-in alert rules generate alert events without sending alert notifications. If you want to configure notification methods for an alert rule, click Edit in the Actions column.
On the Edit Prometheus Alert Rule page, you can configure custom alert thresholds, duration, and alert content. For more information, see Create an alert rule for a Prometheus instance.

Metrics
Metric | Measurement | Description |
eventer_events_error_total | COUNTER | The count of error events. |
eventer_events_normal_total | COUNTER | The count of normal events. |
eventer_events_warning_total | COUNTER | The count of exception events. |
eventer_exporter_duration_milliseconds | SUMMARY | The count of milliseconds spent exporting events. |
eventer_manager_last_time_seconds | GAUGE | The Unix timestamp of the last eventer housekeep in seconds. |
eventer_scraper_duration_milliseconds | SUMMARY | The count of milliseconds spent scraping events. |
eventer_scraper_events_total_number | COUNTER | The total number of events. |
eventer_scraper_last_time_seconds | GAUGE | The Unix timestamp of the last event in seconds. |