To monitor and manage SQL statements executed in a database instance, you can use the SQL Explorer and audit feature to record and analyze their performance. After the feature is enabled, the system automatically records all SQL statements executed by the database kernel, along with related information such as the execution account, source IP address, and execution details. The process introduces zero performance overhead on the instance. The feature provides also traffic replay and stress testing capabilities, to help you determine if your current instance specifications can handle peak business traffic or require scaling up.
Features
SQL audit: queries and exports SQL statements along with related information, such as the database, execution status, and execution duration.
SQL Explorer: diagnoses the health of SQL operations, troubleshoots performance issues, and analyzes business traffic.
Traffic playback and stress testing: simulates the load on your database by replaying recorded traffic and conducting stress tests, to help you determine whether your database instance's specifications need to be scaled up to handle peak business traffic
Enable SQL insight and stress testing (new version)
Log on to the PolarDB-X console and go to the Basic Information page of the instance. In the left navigation pane, select .
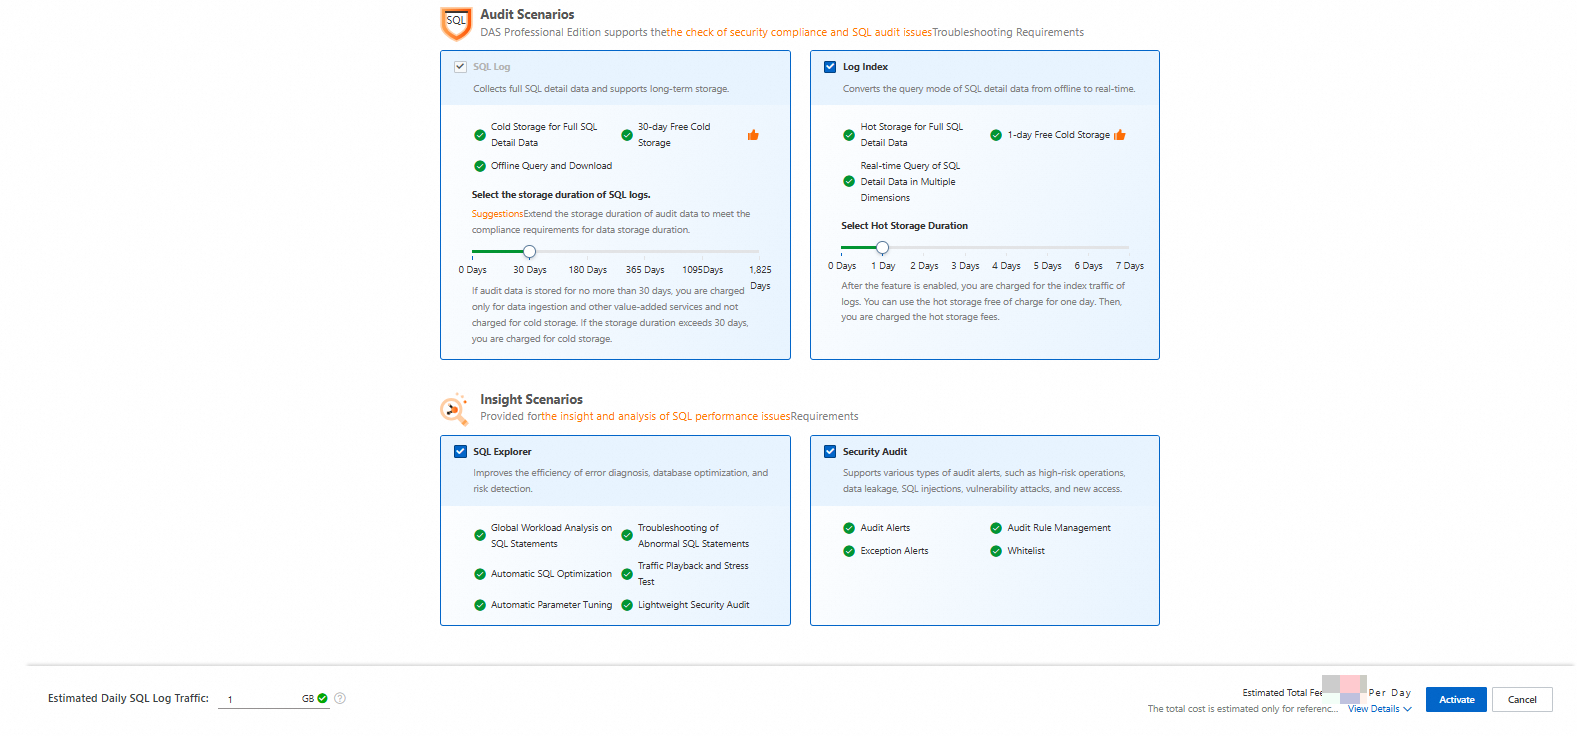
Click Enable DAS Enterprise Edition V3, configure Audit Scenarios as needed, and then click Activate.