Query Insights is a query analysis feature in PolarSearch. It helps you understand your cluster's query load through live query monitoring, top n query analysis, and configuration management. This allows you to quickly identify and optimize performance bottlenecks.
Availability
This feature is available in PolarSearch 3.0 and later.
Access
Log in to the PolarSearch Dashboard and navigate to OpenSearch Plugins > Query Insights. Query Insights consists of the following three modules:
-
Live queries: Monitor the current query load on your cluster in real time.
-
Top n queries: Record and analyze inefficient queries within a specific time period.
-
Configuration: Define criteria for slow queries, rules for statistics, and data retention policies.
Enable Query Insights
Query Insights is disabled by default in PolarSearch. You can enable it from the Dashboard or by using a command line tool.
Dashboard
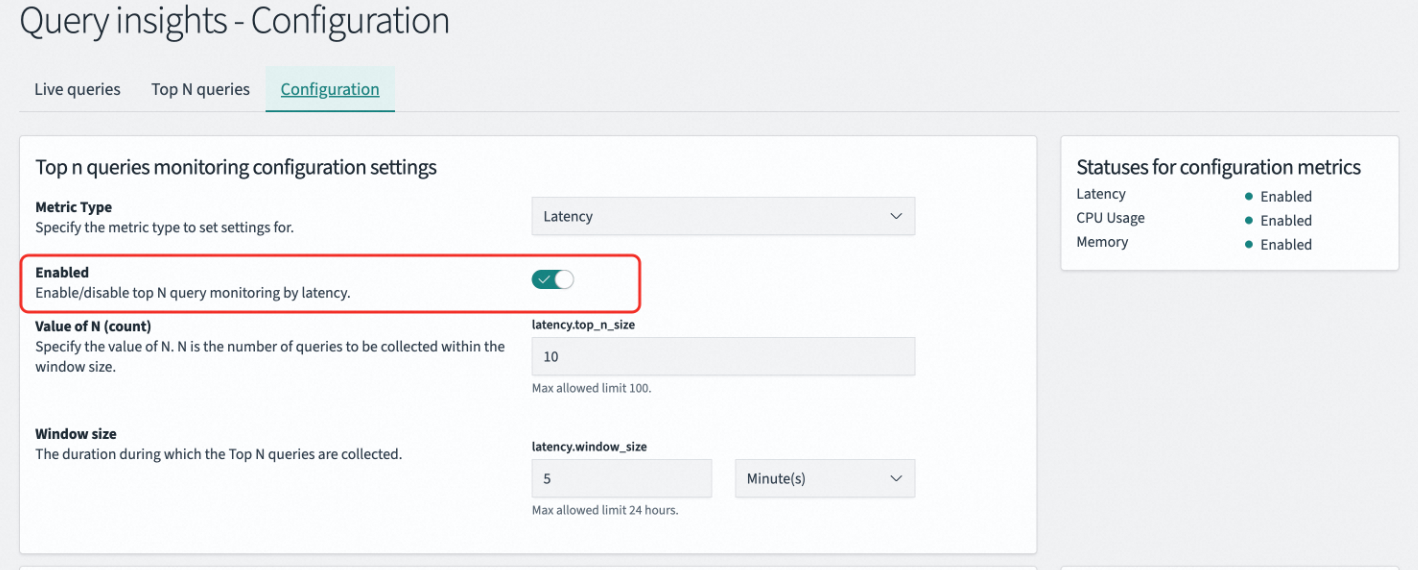
Navigate to OpenSearch Plugins > Query Insights > Configuration. To enable the feature, toggle the Enabled switch off, save, and then toggle it on and save again.
CLI
curl -XPUT "http://<endpoint>:<port>/_cluster/settings?pretty" \
--user "<user_name>:<passwd>" \
-H 'Content-Type: application/json' \
-d '{
{
  "persistent": {
    "search.insights.top_queries.latency.enabled": true
  }
}'
Live queries
The Live queries page lets you monitor your cluster's current query load in real time. It displays key performance metrics, load distribution, and statistical counts for all active queries.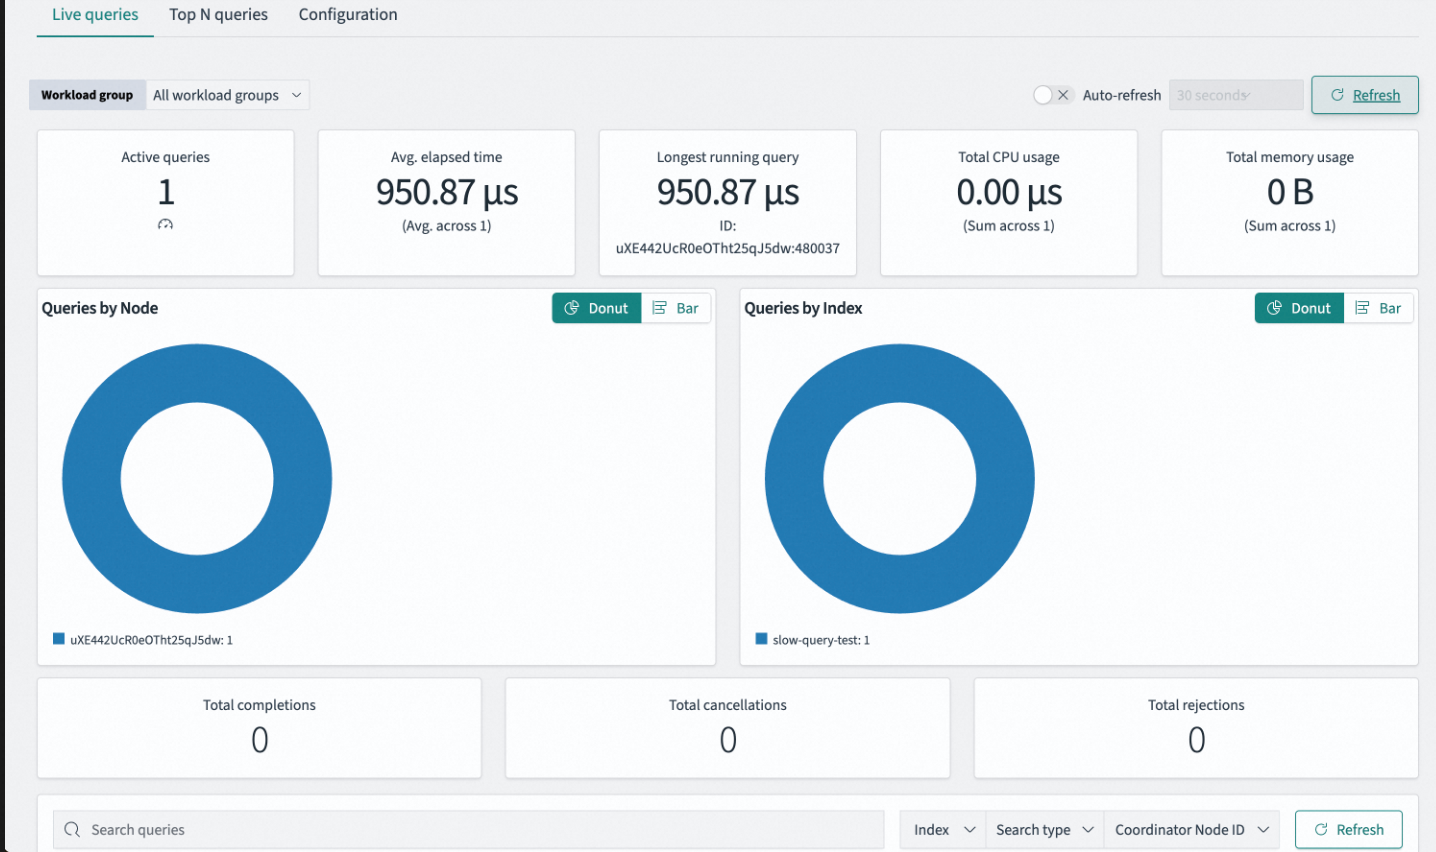
Query metrics
|
Metric |
Description |
|
Active queries |
The total number of query requests currently executing on the cluster. Use this metric to assess the concurrent load and identify if tasks are accumulating. |
|
Avg. elapsed time |
The arithmetic average of the time elapsed since all active queries started. Use this metric to measure the cluster's real-time response latency, system congestion, and processing efficiency. |
|
Longest running query |
The latency of the longest-running active query. Use this metric to quickly pinpoint potential long-tail latency or blocking queries. |
|
Total CPU usage |
The total CPU resources consumed by all active queries. Use this metric to identify whether queries are CPU-intensive operations, such as a complex aggregation, analysis, or script score calculation. |
|
Total memory usage |
The total heap memory occupied by all active queries. Use this metric to identify memory-intensive operations, such as large-scale sorting, deep pagination, or high-cardinality aggregations, and to provide an early warning of out-of-memory (OOM) risks. |
Distribution charts
Distribution charts provide a visual representation of how the load is distributed across the cluster.
|
Chart |
Description |
|
Queries by node |
Shows the distribution of active queries across data nodes. Use this chart to check load balancing, identify a hot spot, and determine if data skew or uneven routing exists. |
|
Queries by index |
Shows which indices the active queries are primarily focused on. Use this chart to locate a hot index and identify which business tables are causing the load. |
Statistical counters
Statistical counters show the cumulative number of events within the current statistical period.
|
Counter |
Description |
|
Total completions |
The total number of queries that have successfully completed within the current statistical period. |
|
Total cancellations |
The number of queries that users canceled or the system terminated due to a timeout. A high value indicates that many queries are being terminated because of slow responses. |
|
Total rejections |
The number of queries rejected by the thread pool. Rejections occur when the cluster's processing capacity is reached and the thread pool queue is full, causing requests to be dropped. |
A consistently increasing value for Total rejections indicates that the cluster load has exceeded its capacity. You should scale out nodes or optimize resource-intensive queries as soon as possible.
Top n queries
The Top n queries page helps you identify and analyze inefficient queries within a specific time period, providing tools for visual analysis and performance optimization.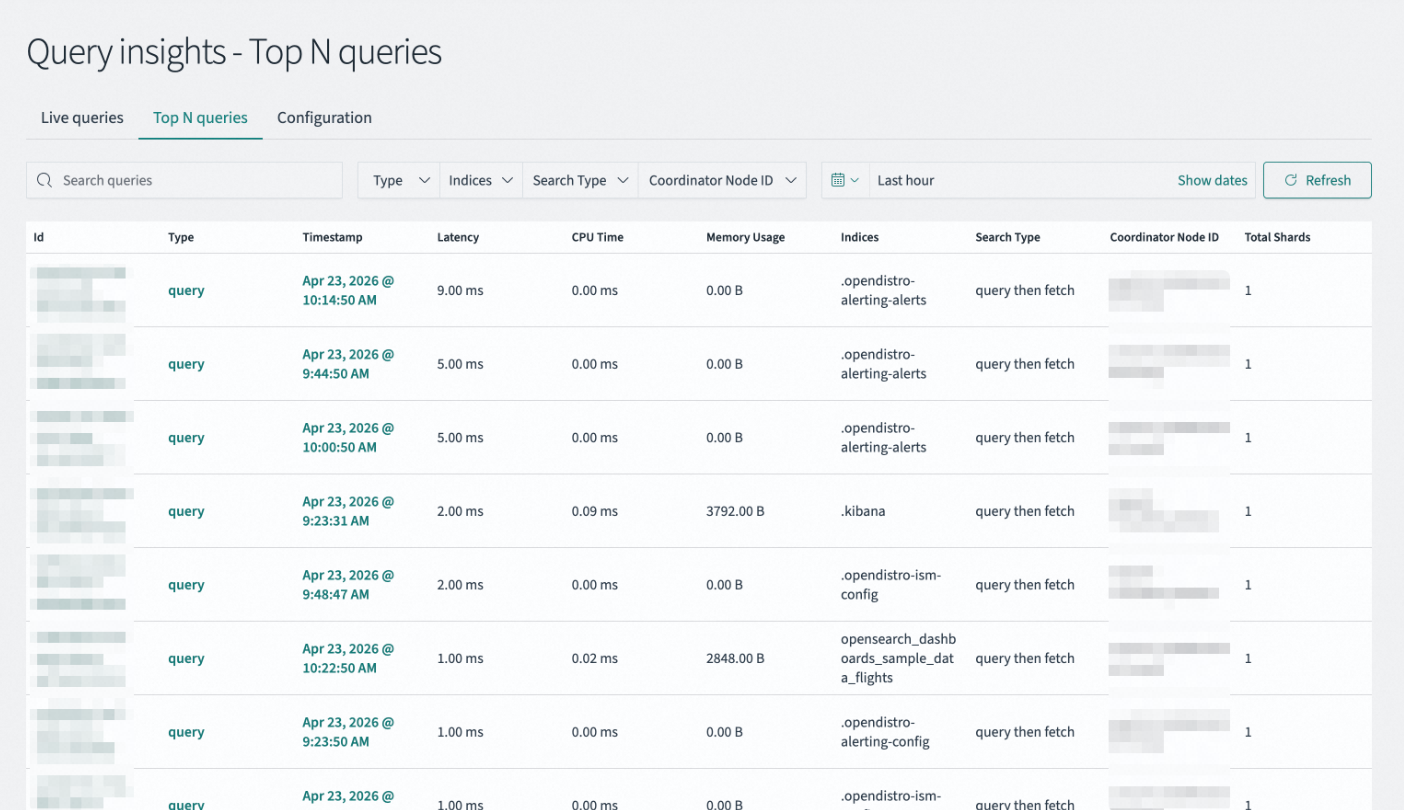
Filter and control bar
|
Filter |
Description |
|
Search queries |
Quickly retrieve specific slow query records by using keywords, such as an index name or part of a query statement. |
|
Type / Indices / Search type / Coordinator node ID |
Multi-dimensional filters to narrow the troubleshooting scope by query type, affected indices, search execution strategy, and coordinator node ID. |
|
Last hour / Show dates |
Set the time window for viewing historical data. You can select a preset time range or define a custom period. |
Query detail fields
The query list displays details for top n queries. The list includes the following fields.
|
Field |
Description |
|
Id |
A unique identifier for the query request. Click the ID to navigate to a detailed query page and view the specific query statement. |
|
Type |
The category of the request operation, for example, a standard search request (query). |
|
Timestamp |
The point in time when the query request was received and began executing. |
|
Latency |
The total time consumed by a query from start to finish, measured in milliseconds. A higher value indicates a slower query and is a primary focus for performance optimization. |
|
CPU Time |
The amount of time the CPU was actively processing the query. If the CPU Time is close to the Latency, the query is compute-intensive. If the CPU Time is much lower than the Latency, the query spent significant time waiting for I/O. |
|
Memory usage |
The amount of heap memory occupied during query execution. Use this metric to identify high-memory-consumption queries and prevent out-of-memory (OOM) risks. |
|
Indices |
The names of the indices that the query scanned or operated on. Use this information to locate hot data and optimize sharding strategies or mapping structures. |
|
Search type |
The specific strategy used to execute the query. Different search types have different performance characteristics. |
|
Coordinator node ID |
The identifier of the coordinator node that received the client request and distributed and aggregated the results. Use this ID to troubleshoot potential node load imbalances. |
|
Total shards |
The total number of shards scanned by the query. Scanning more shards increases overhead. Optimize routing or reduce unnecessary index scans to improve performance. |
Configuration
The Configuration page is the control center for Query Insights. Use it to define the criteria for identifying slow queries, rules for statistics, and data retention policies.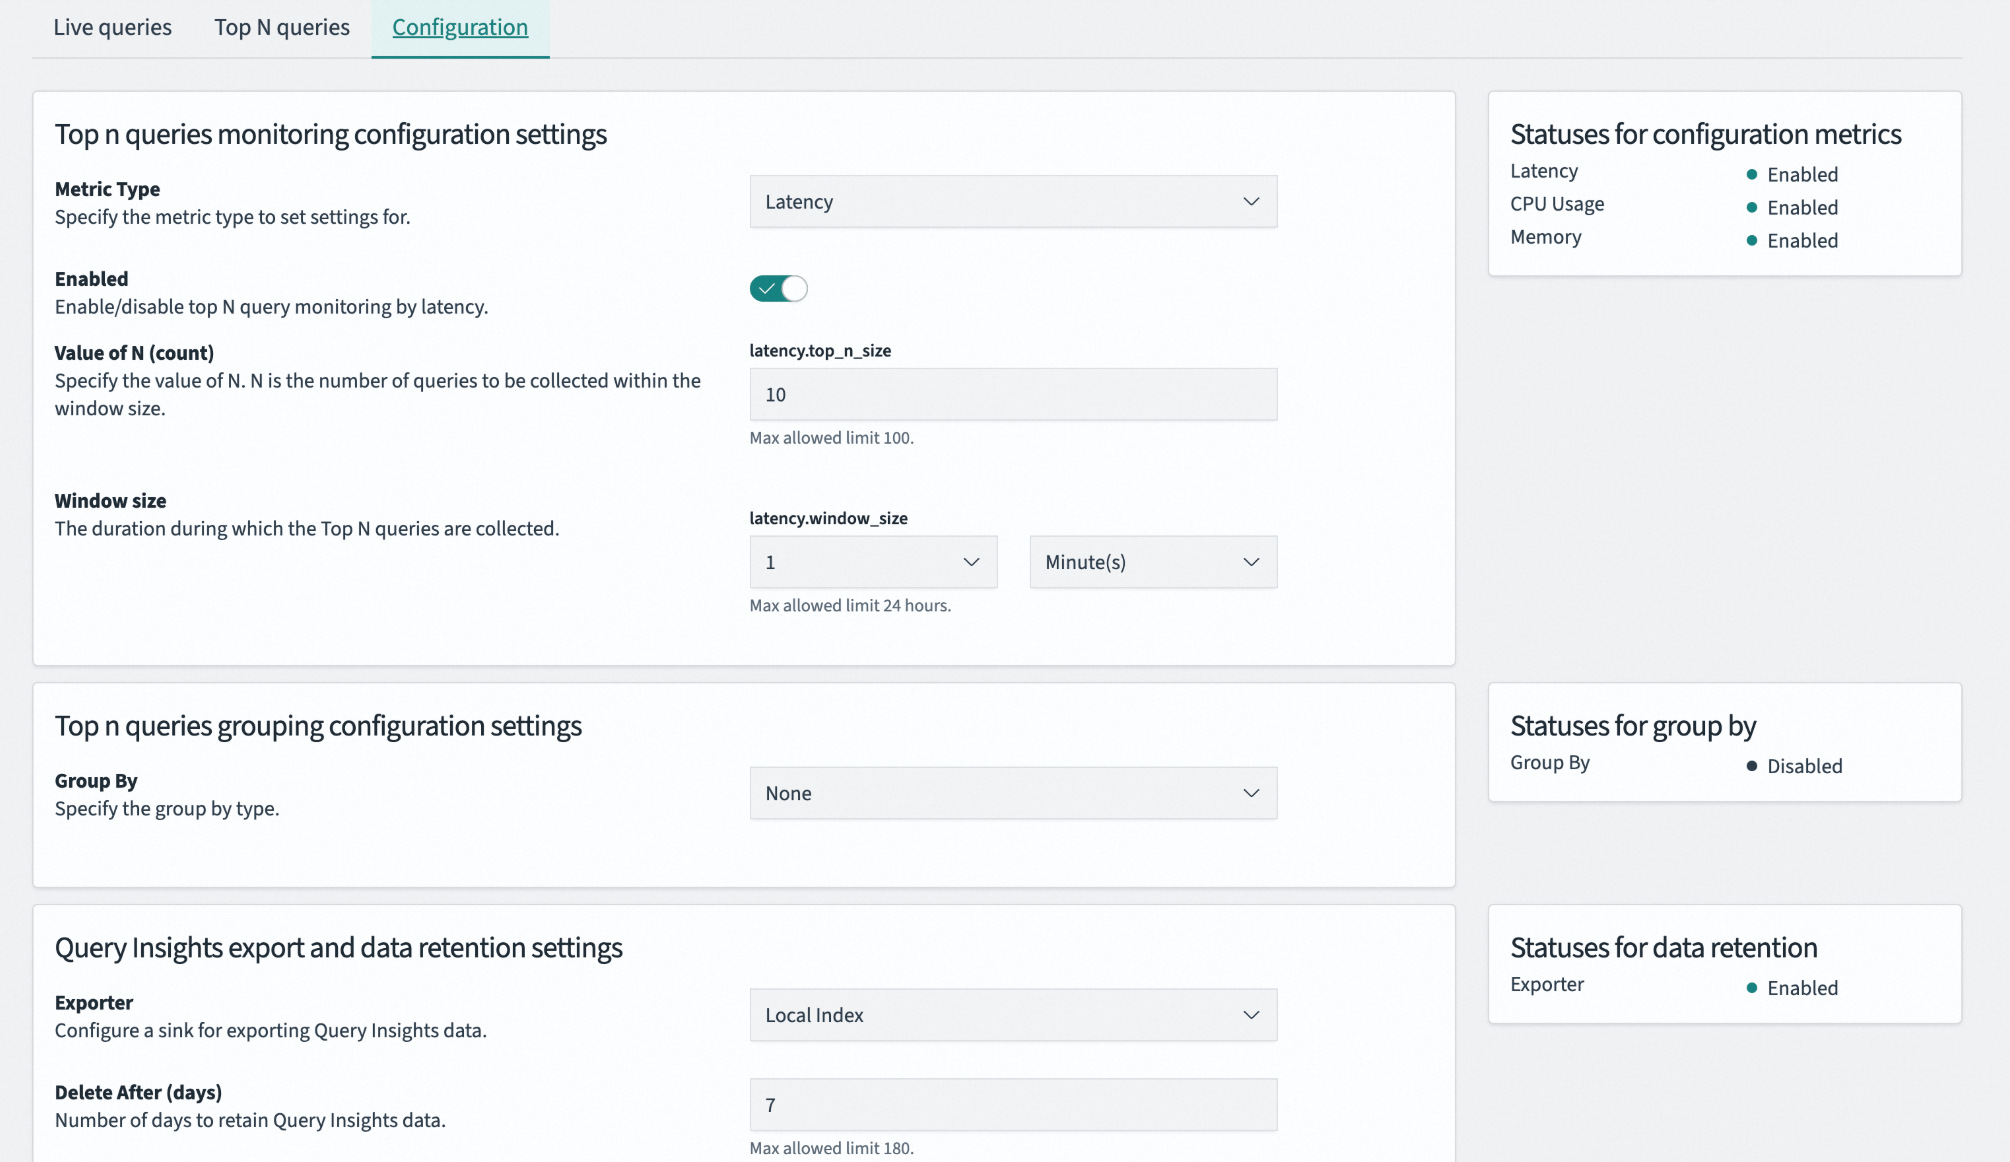
Top n queries monitoring configuration
Defines how the system identifies and records slow or resource-intensive queries.
|
Parameter |
Description |
|
Metric type |
Specifies the core metric used to evaluate query performance. You can select Latency, CPU Usage, or Memory. |
|
Enabled |
Enables or disables the top n queries monitoring feature for the selected metric type. Disabling it can reduce system overhead but will stop the generation of related diagnostic data. |
|
Value of N |
Sets the number of top-ranking query records to retain within a statistical time window. A small value may miss issues, while a large value increases storage overhead. The maximum value is 100. |
|
Window size |
Defines the time period for statistics and ranking. A shorter window can capture instantaneous spikes, while a longer window reflects sustained load issues. The maximum value is 24 hours. |
Top n queries grouping configuration
Defines how similar queries are grouped to prevent the list from being dominated by a large number of repetitive queries.
|
Parameter |
Description |
|
Group by |
Specifies the dimension used for query fingerprinting and grouping. When enabled, the system groups structurally identical queries for statistical analysis. This prevents a single, high-frequency query from dominating the list and helps you identify recurring performance patterns. |
Data export and retention
Manages the storage location and lifecycle of monitoring data.
|
Parameter |
Description |
|
Exporter |
Specifies the storage destination for data collected by Query Insights. Local Index indicates that the data is stored in a dedicated index within the cluster. |
|
Delete After |
Sets the maximum retention period for monitoring data, after which it is automatically deleted. A short retention period may hinder historical trend analysis, while a long one can cause the monitoring index to grow excessively. |
Status panel
The read-only Status Panel on the right side of the page provides real-time feedback on your configuration, including:
-
Statuses for configuration metrics: Shows the enabled status for the three core metrics: latency, CPU usage, and memory.
-
Statuses for group by: Shows whether the query grouping feature is enabled or disabled.
-
Statuses for data retention: Shows whether the data exporter is functioning correctly and writing data to the storage location.