The PolarDB console allows you to monitor various performance metrics and view monitoring data at intervals of seconds. You can monitor the status of your cluster and identify faults based on the monitoring data.
Procedure
Log on to the PolarDB console.
In the left-side navigation pane, click Clusters.
In the upper-left corner, select the region where the cluster to which you want to connect is deployed.
Find the cluster and click its ID.
In the left-side navigation pane, choose .
View the monitoring data on the Cluster, PolarProxy, Compute Node, Advanced Monitoring, or Performance Events tabs. For more information, see Metrics.
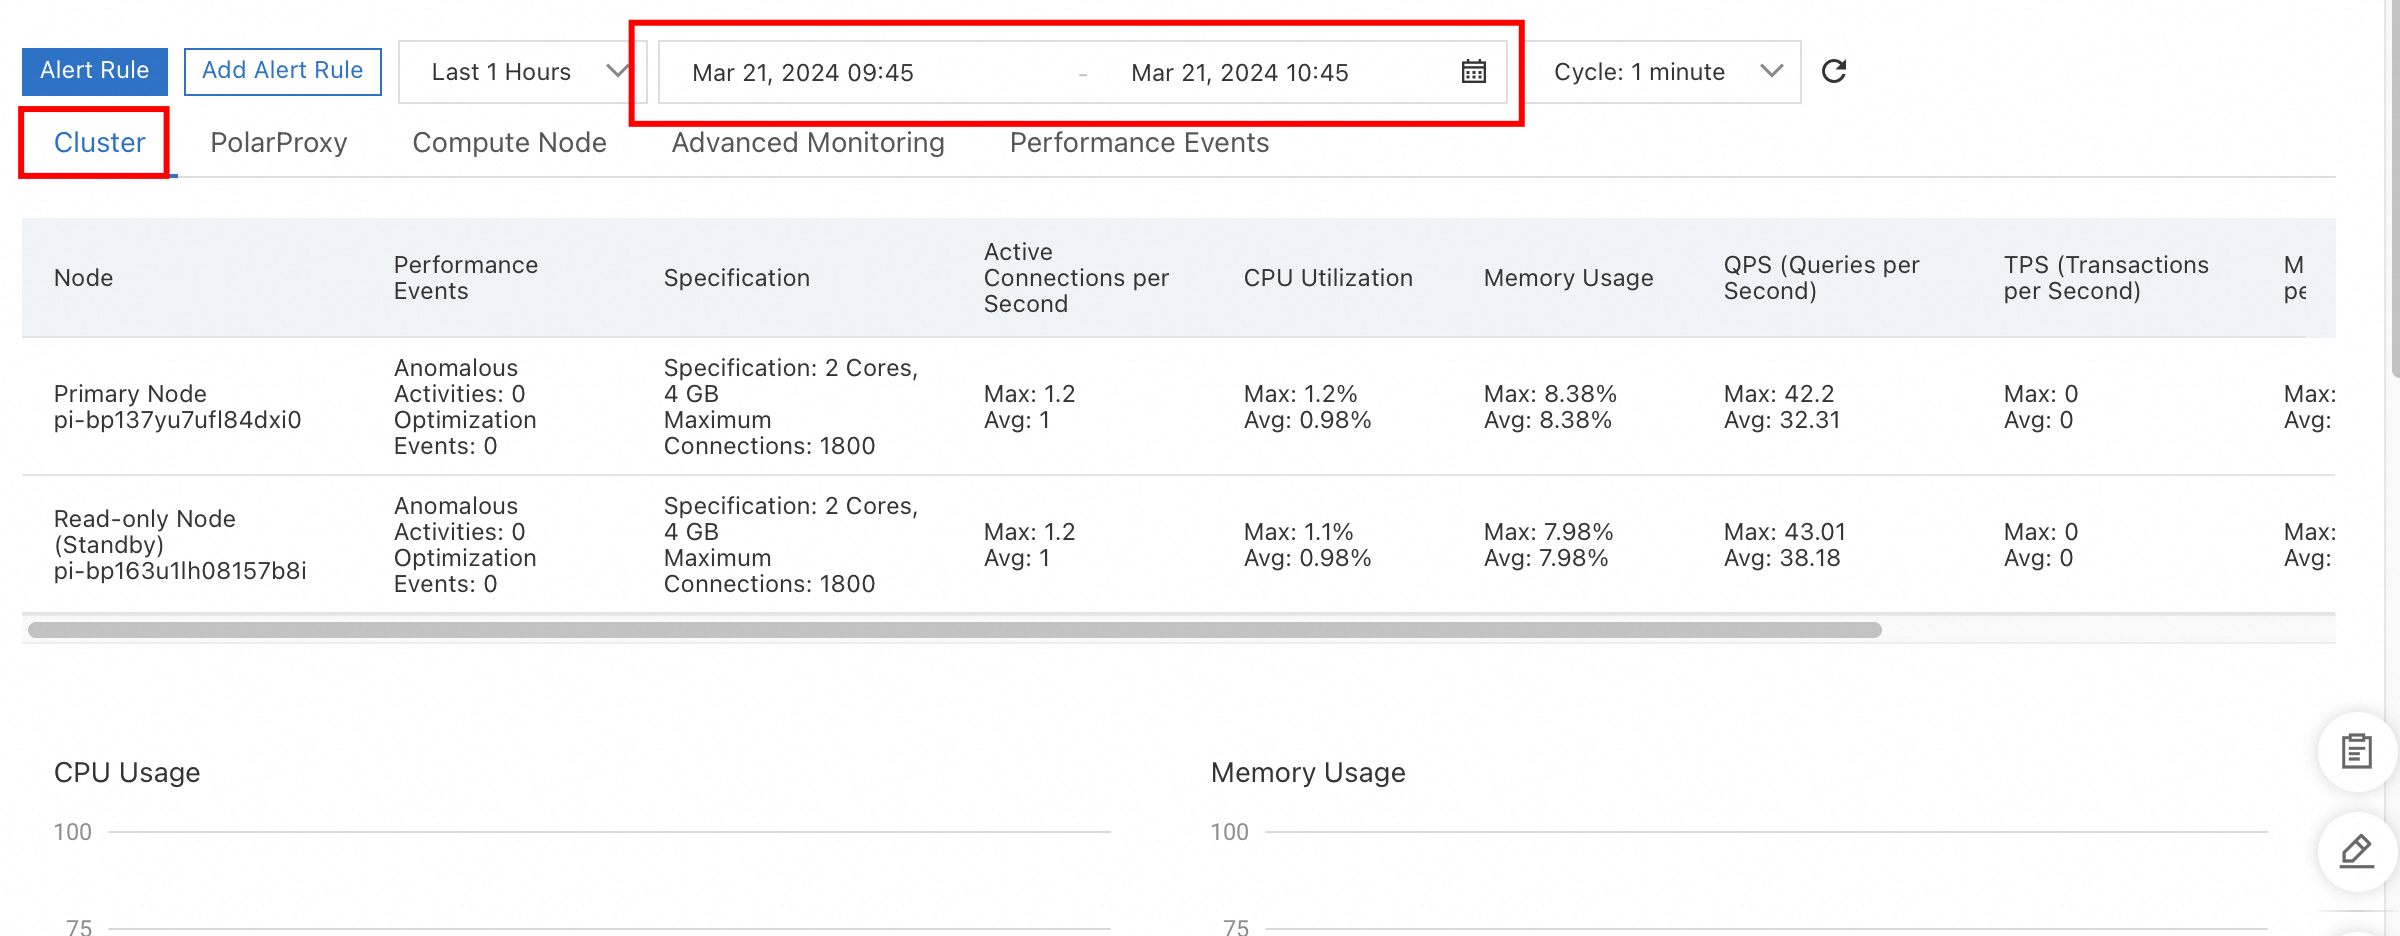
To view cluster performance monitoring data, click the Cluster tab and specify a period of time in the upper part of the page.
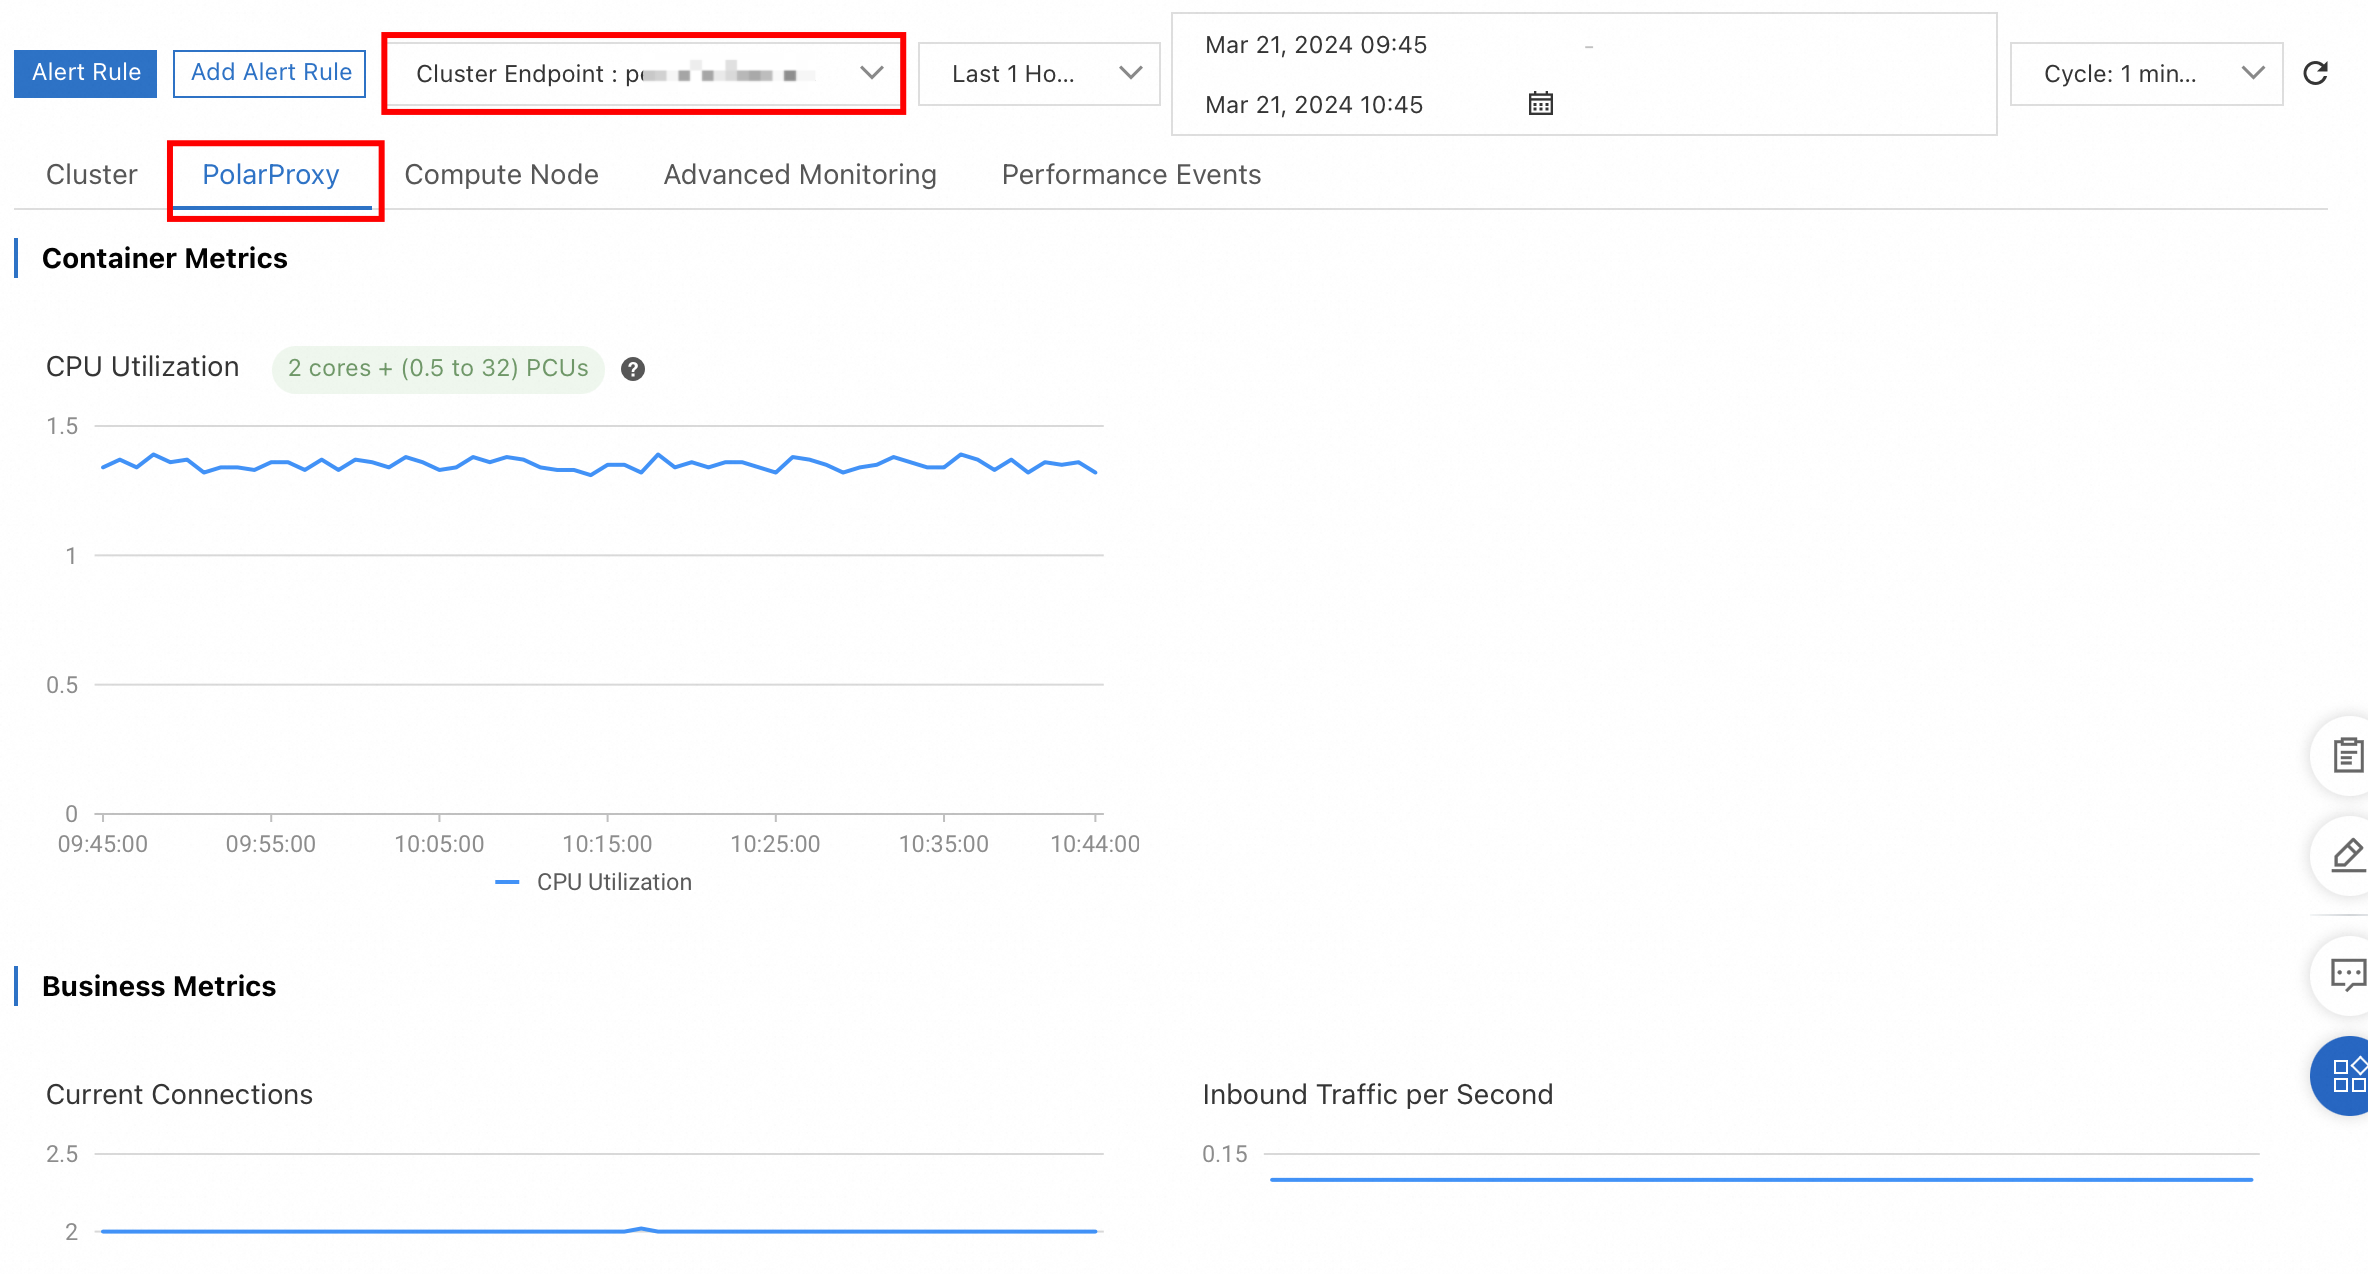
To view PolarProxy performance monitoring data, click the PolarProxy tab, select a cluster endpoint and specify a period of time in the upper part of the page.
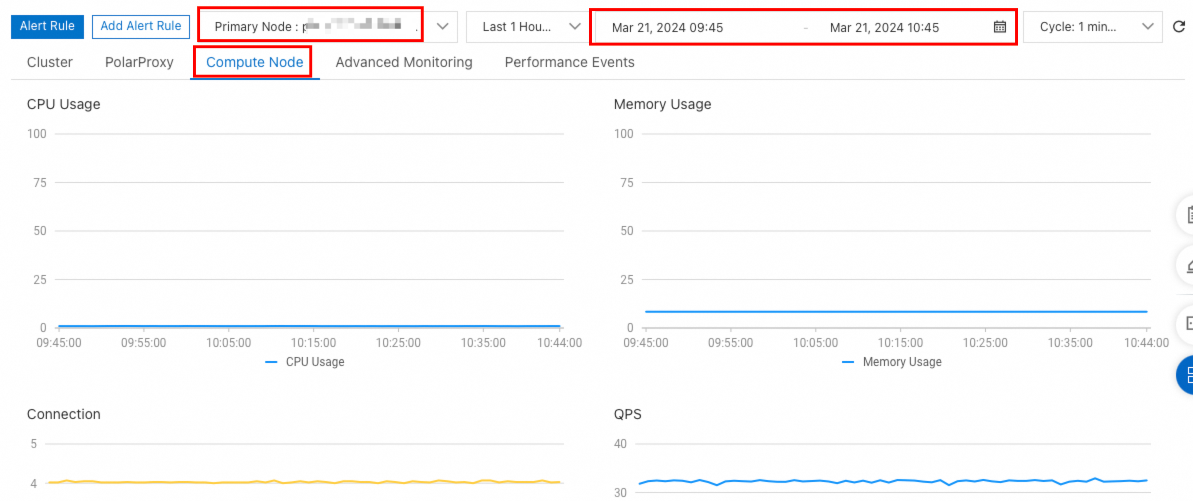
To view compute node performance monitoring data, click the Compute Node tab, select a node from the drop-down list and specify a period of time in the upper part of the page.
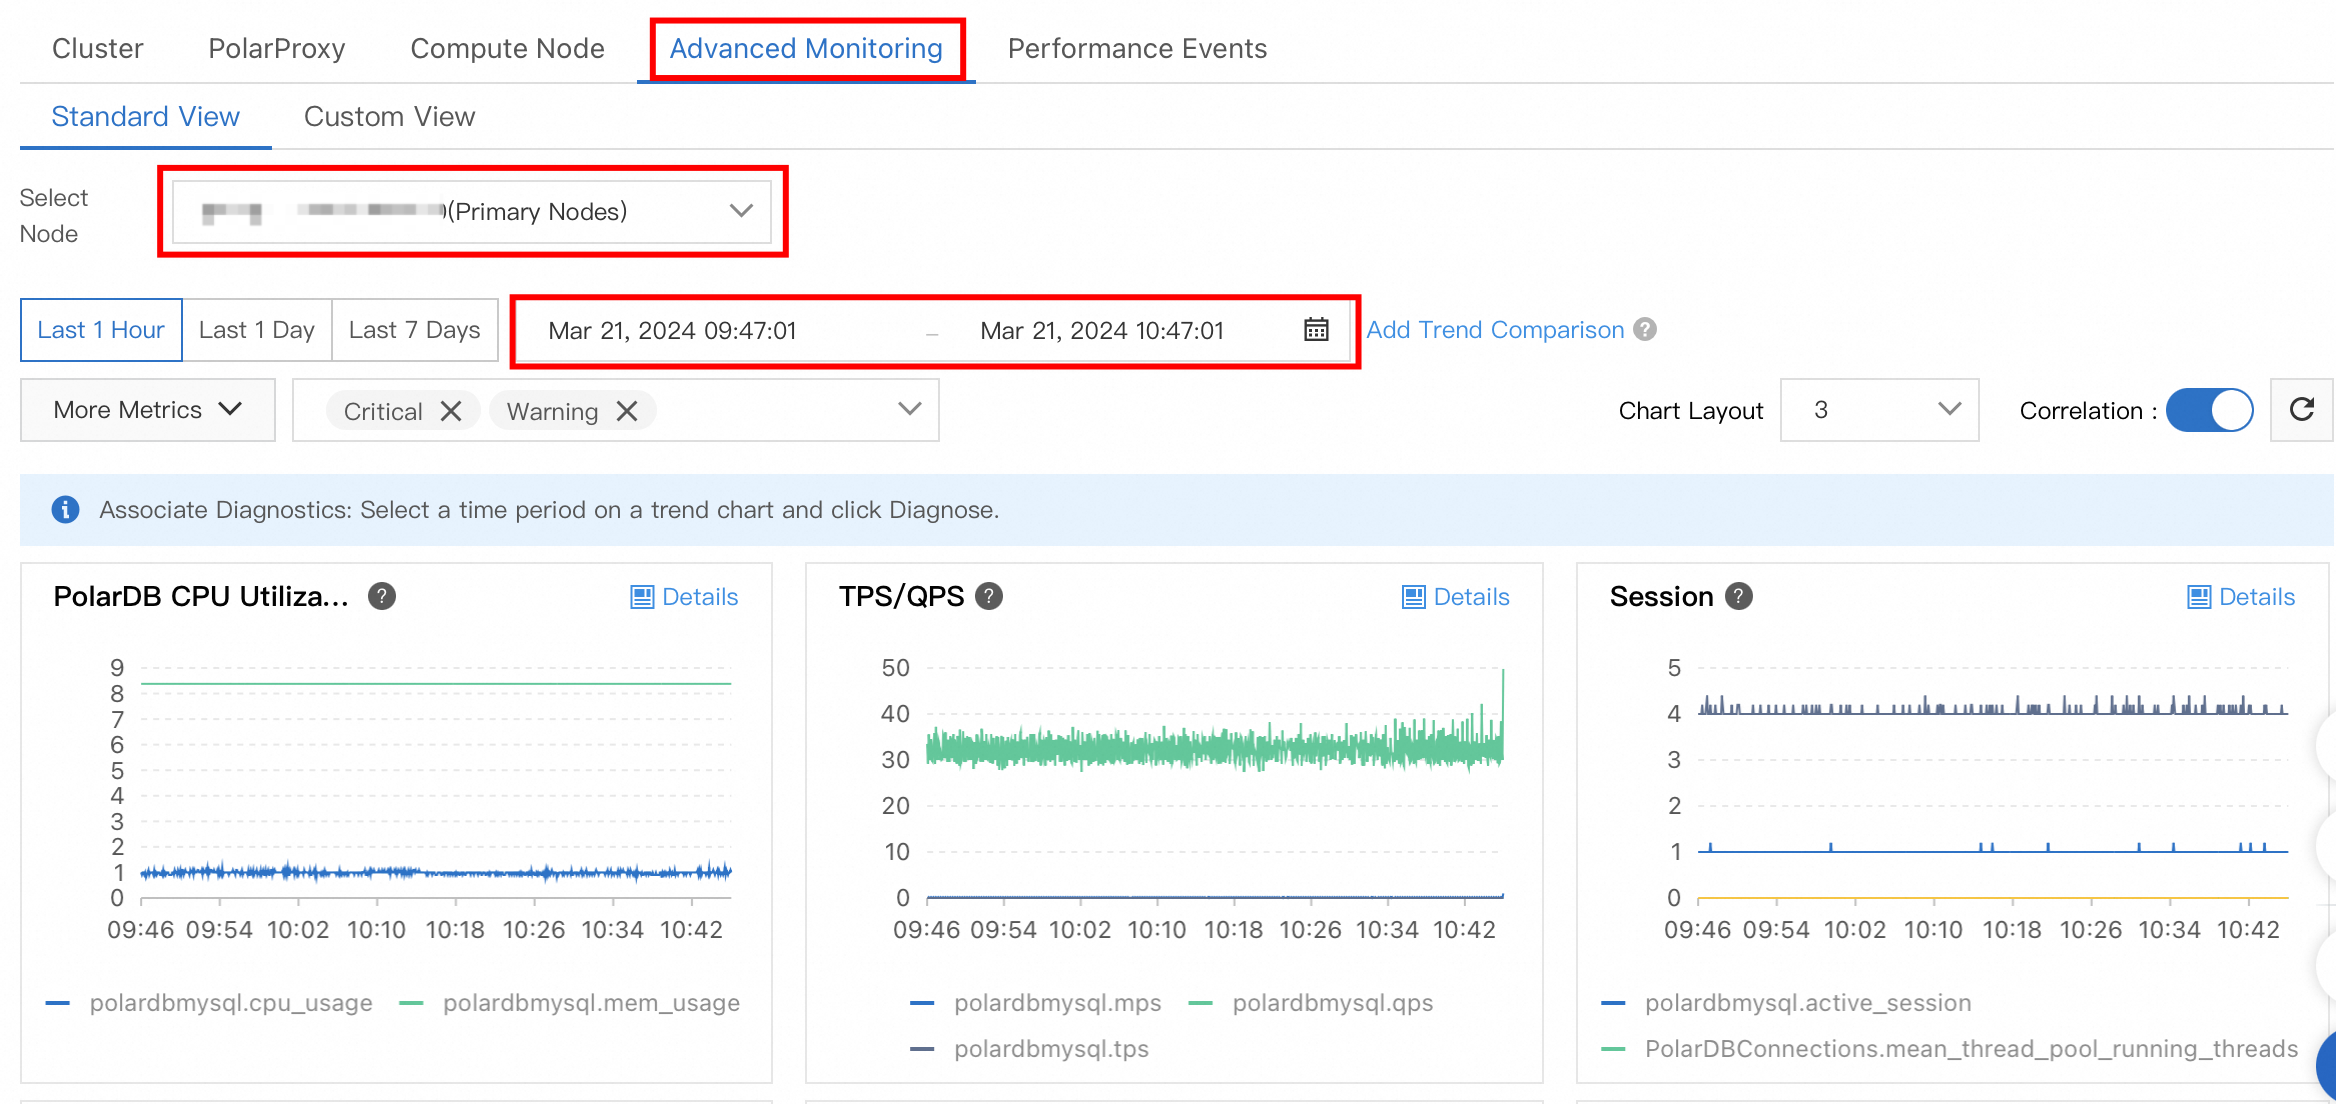
To view advanced monitoring data, click the Advanced Monitoring tab, select a node from the drop-down list and specify a period of time in the upper part of the page.
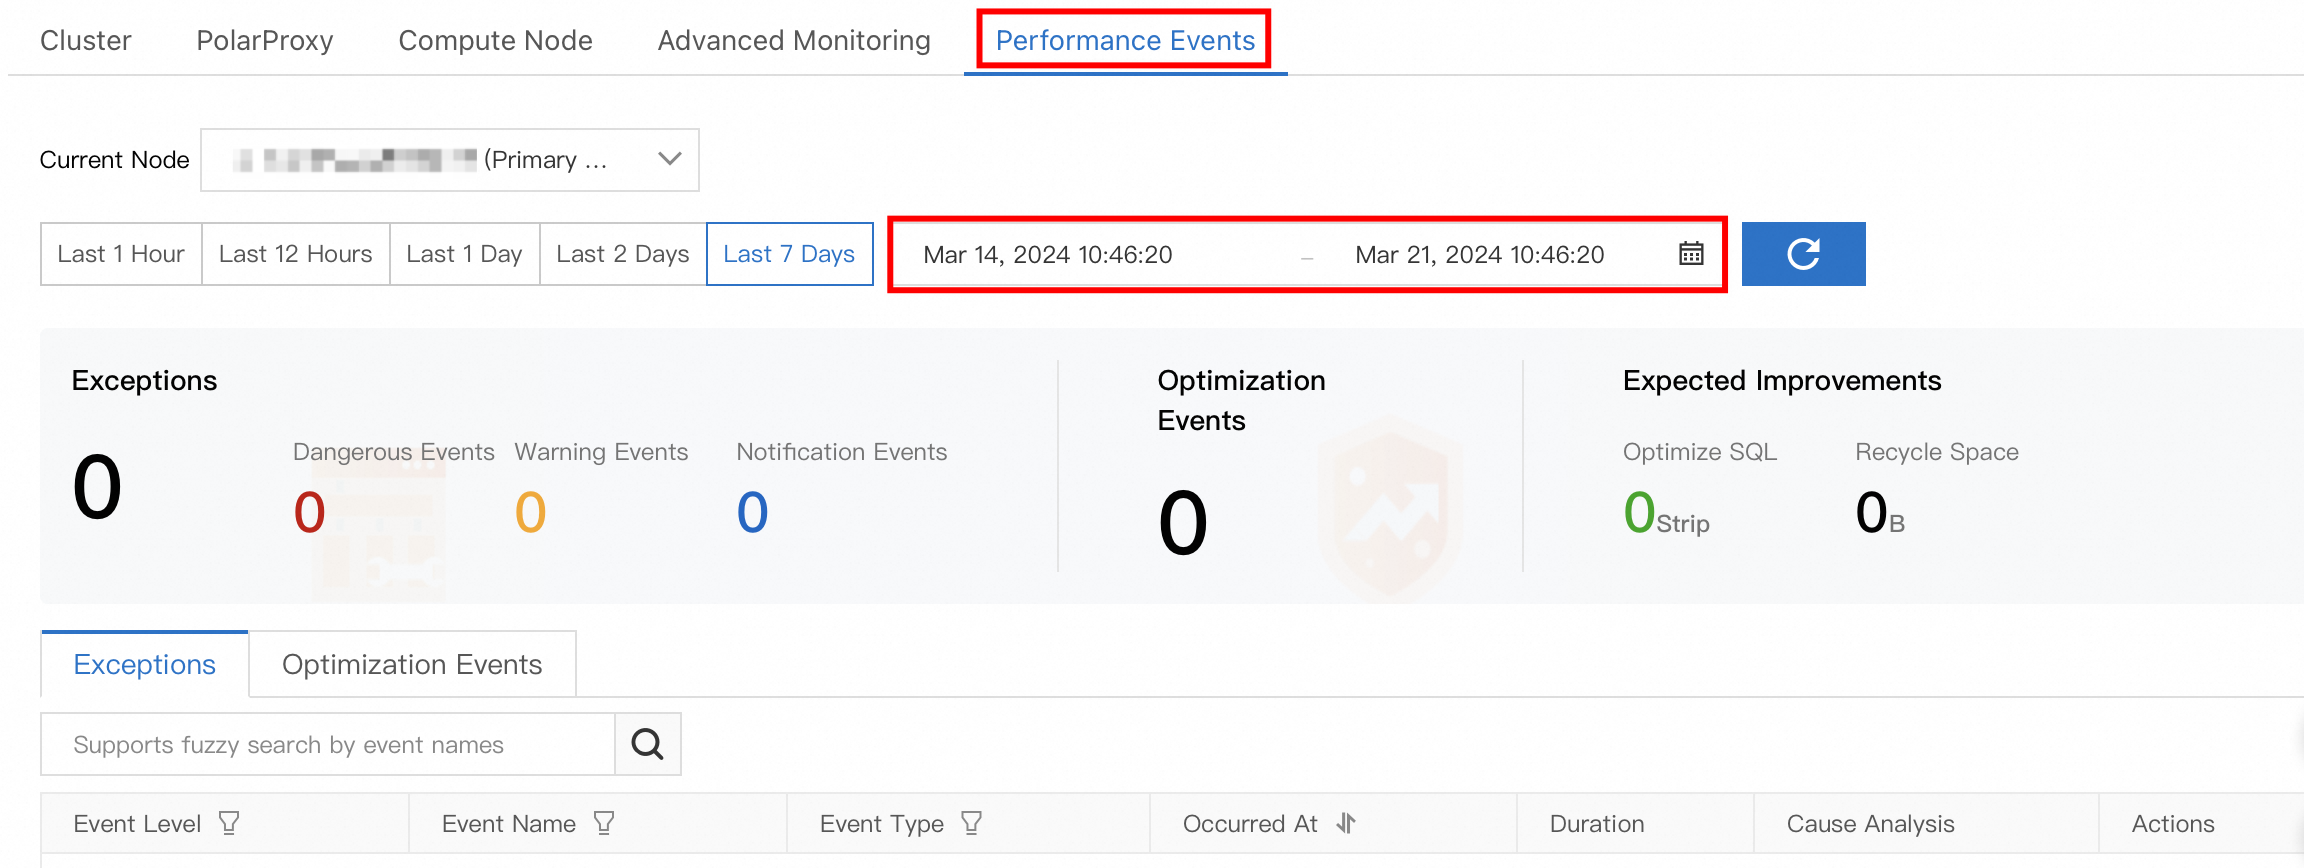
To view performance events, click the Performance Events tab, select a node from the drop-down list and specify a period of time in the upper part of the page.
On the Real-time Monitoring Dashboard page in the Database Autonomy Service (DAS) console, you can view the monitoring data about PolarDB for MySQL. This can help you identify abnormal clusters for further analytics and optimization.
Metrics
Tab | Metric | Description |
Cluster | Storage Capacity | Displays the sizes of log files such as binary log and redo log files, and the storage used by data files, system files, and temporary files. Contact Alibaba Cloud technical support to obtain this metric. |
QPS | Displays the queries per second (QPS) of each node. The values are sourced from the | |
TPS | Displays the transactions per second (TPS) of each node. The values are sourced from the | |
MPS | Displays the manipulations per second (MPS) of each node. The values are sourced from the | |
CPU Usage | Displays the CPU usage of each node. Contact Alibaba Cloud technical support to obtain this metric. | |
Memory Usage | Displays the memory usage of each node. Contact Alibaba Cloud technical support to obtain this metric. | |
Connections | Displays the number of active connections per second on each node. The values are sourced from the statistical information in the output of the | |
Redo Logs Written per Second | Displays the number of redo logs written per second for the primary node. | |
Compute Node | QPS | Displays the QPS of the selected node. The values are sourced from the |
TPS | Displays the TPS of the selected node. The values are sourced from the | |
MPS | Displays the manipulations per second (MPS) of each node. The values are sourced from the | |
CPU Usage | Displays the CPU usage of the selected node. Contact Alibaba Cloud technical support to obtain this metric. | |
Memory Usage | Displays the memory usage of the selected node. Contact Alibaba Cloud technical support to obtain this metric. | |
Connections | Displays the total number of connections and the number of active connections on the selected node. The values are sourced from the statistical information in the output of the | |
Actions | Displays the number of operations performed per second on the selected node. The operations counted include the DELETE, INSERT, UPDATE, and REPLACE operations. The values are sourced from the metrics whose names start with | |
Memory Buffer Pool | Displays the dirty ratio, read hit ratio, and usage of the buffer pool on the selected node. The values are sourced from | |
I/O Throughput | Displays the total I/O throughput, read I/O throughput, and write I/O throughput of the selected node. Contact Alibaba Cloud technical support to obtain this metric. | |
IOPS | Displays the total IOPS, read IOPS, and write IOPS of the selected node. Contact Alibaba Cloud technical support to obtain this metric. | |
Network | Displays the input traffic per second and output traffic per second of the selected node. The values are sourced from the | |
Scanned Rows | Displays the numbers of rows that are inserted, read, updated, and deleted per second on the selected node. The values are sourced from the | |
InnoDB Read and Written Data | Displays the amount of data that is read from or written into the storage engine per second on the selected node. The values are sourced from the | |
InnoDB Buffer Pool Requests | Displays the number of read operations and the number of write operations that are performed per second on the buffer pool of the selected node. The values are sourced from the | |
InnoDB Log Writes | Displays the number of log write requests per second and the number of times that data is synchronized to disks per second on the selected node. The values are sourced from the | |
Temporary Table | Displays the number of temporary tables that are created per second on the selected node. The values are sourced from the | |
PolarProxy | CPU Utilization | The CPU utilization on PolarProxy. |
Current Connections | The number of new connections per second on PolarProxy. | |
Inbound Traffic per Second | The amount of inbound network traffic per second on PolarProxy. | |
Outbound Traffic per Second | The amount of outbound network traffic per second on PolarProxy. | |
Queries per Second | The number of requests per second on PolarProxy. | |
Advanced Monitoring | PolarDB CPU Utilization/Memory Usage | Displays the CPU utilization and memory usage for the selected node. |
TPS/QPS | Displays the TPS and QPS for the selected node. | |
Session | Displays the current numbers of total sessions and active sessions on the selected node. | |
Traffic Throughput (KB) | Displays the average number of bytes sent to and received from all clients per second on the selected node. | |
Temporary Table | Displays the number of temporary tables that are created per second on the selected node. | |
Executions | Displays the average number of executions of REPLACE, MULTI_DELETE, MULTI_UPDATE, INSERT_SELECT, DELETE, SELECT INSERT, REPLACE_SELECT, and UPDATE statements per second on the selected node. | |
Replication Latency | Displays the replication latency for the selected node. | |
InnoDB Read/write Throughput (KB) | Displays the average read bytes and write bytes per second by InnoDB on the selected node. | |
InnoDB Buffer Pool Requests | Displays the average numbers of page reads (logical reads) from and page writes to the buffer pool per second by InnoDB on the selected node. | |
InnoDB Buffer Pool Hit Ratio | Displays the buffer pool usage, dirty page ratio, and read cache hit ratio of InnoDB on the selected node. | |
InnoDB Redo Writes | Displays the average number of physical log writes per second and the number of synchronizations per second for the selected node. | |
InnoDB Row Operations | Displays the average number of rows that InnoDB reads, updates, inserts, and deletes per second on the selected node. | |
PolarDB Storage Space Used (MB) | Displays the storage used for redo log data, binary log data, system data, business data, log files, and temporary files on the selected node. | |
PolarDB IOPS | Displays the number of reads and writes per second for the selected node, including the total number of reads and writes per second, the number of reads per second, the number of writes per second, the total I/O throughput, the read I/O throughput, and the write I/O throughput. |
FAQ
Why is the QPS that is displayed on the Monitoring page approximately 10 when the service traffic of my cluster is 0?
The monitoring, log collection, and administration tasks that run in the system background generate approximately 10 queries per second. This has little impact on the performance of your cluster.
How do I reduce the CPU utilization when the CPU utilization is excessively high?
We recommend that you perform the following steps:
Check whether a large number of slow requests exist. If a large number of slow requests exist, we recommend that you optimize slow SQL statements first. For more information about how to view and optimize slow SQL statements, see Slow SQL queries.
Check whether the trend of the CPU utilization curve is consistent with that of the QPS or TPS curve. If the curves are consistent, the issue is caused by high concurrency of transactions. In this case, we recommend that you upgrade the specifications of your cluster. For more information about how to upgrade the configuration, see Manually upgrade or downgrade a PolarDB cluster.
If no slow requests exist and the trend of the CPU utilization curve is inconsistent with that of the QPS or TPS curve, contact Alibaba Cloud technical support.
What do I do when the number of connections is much greater than the number of active connections?
You can specify smaller values for the wait_timeout and interactive_timeout parameters to accelerate the release of idle connections. We recommend that you close the connections that are no longer in use in time to reduce the number of idle connections.
Related API operation
API | Description |
Queries the performance data of a PolarDB cluster. | |
Queries the performance data of a node in a PolarDB cluster. | |
Queries the interval at which the monitoring data of a PolarDB cluster is collected. |