PolarDB for MySQL provides the advanced monitoring feature. The advanced monitoring feature supports a wide range of performance metrics, custom charts, and powerful diagnostic capabilities. The feature can detect events on clusters immediately after they occur and automatically diagnose them. The feature also provides root cause analysis and suggestions. Manual diagnostics within a specific time period is also supported to help you understand the running status of clusters.
Procedure
Log on to the PolarDB console.
In the upper-left corner, select the region where the cluster is deployed.
Find the cluster and click its ID.
In the left-side navigation pane, choose .
Click the Advanced Monitoring tab.
On the Standard View tab, you can select a node to view its performance trend charts of the last one hour, last one day, or last seven days.
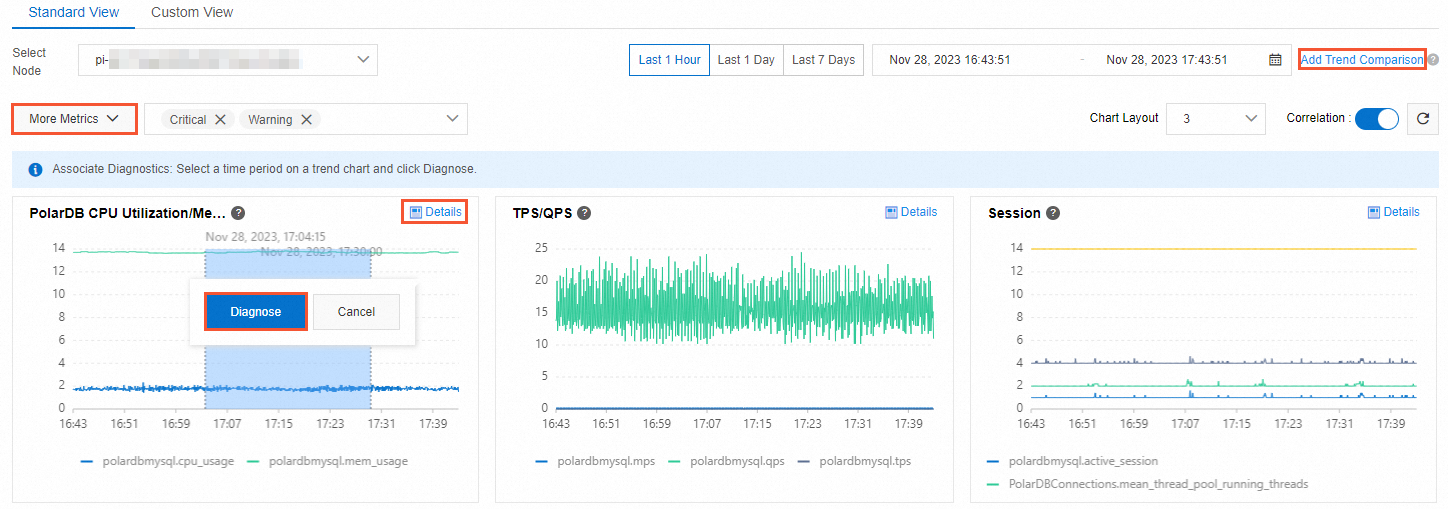
Click More Metrics to view the performance trends of the metrics.
You can click Add Trend Comparison to view the comparison of performance trends for a metric within different time ranges.
You can specify a time range and click Diagnose in the trend chart of a monitoring item to analyze the metrics in the selected time range.
You can click Details in the trend chart of a monitoring item to expand the chart. You can also change the time range to view the change trends of the monitoring item in a specific time range.
On the Custom View tab, you can customize multiple performance monitoring dashboards based on your business requirements. You can view multiple performance monitoring metrics in the same chart for troubleshooting and analysis.
NoteThe first time you use Custom View, you must create dashboards. For more information, see Monitoring dashboards.
Performance metrics
The advanced monitoring feature allows you to view the following performance metrics.
To view the details of a metric, click  to the right of the metric name.
Category | Metric | Description |
PolarDB CPU Utilization/Memory Usage | polardbmysql.mem_usage | The memory usage of the cluster as a percentage of the total memory of the operating system. Unit: percentage. |
polardbmysql.cpu_usage | The CPU utilization of the service process. 200% indicates that 2 CPU cores are used. Unit: percentage. | |
TPS/QPS | polardbmysql.mps | The number of operations per second. |
polardbmysql.tps | The number of transactions per second. Formula: (Com_commit + Com_rollback)/Uptime | |
polardbmysql.qps | The number of queries per second (QPS). Formula: Queries/Uptime | |
Sessions | polardbmysql.active_session | The number of active sessions. |
polardbmysql.total_session | The total number of sessions. | |
Traffic Throughput | polardbmysql.output_traffic | The average number of bytes that are sent to all clients per second. Unit: KB/s. |
polardbmysql.input_traffic | The average number of bytes that are received from all clients per second. Unit: KB/s. | |
Temporary Table | polardbmysql.created_tmp_disk_tables | The number of temporary tables created per second. |
Executions | polardbmysql.com_replace | The average number of REPLACE statements that are executed per second. |
polardbmysql.com_delete_multi | The average number of MULTI_DELETE statements that are executed per second. | |
polardbmysql.com_update_multi | The average number of MULTI_UPDATE statements that are executed per second. | |
polardbmysql.com_insert_select | The average number of INSERT_SELECT statements that are executed per second. | |
polardbmysql.com_delete | The average number of DELETE statements that are executed per second. | |
polardbmysql.com_select | The average number of SELECT statements that are executed per second. | |
polardbmysql.com_insert | The average number of INSERT statements that are executed per second. | |
polardbmysql.com_replace_select | The average number of REPLACE_SELECT statements that are executed per second. | |
polardbmysql.com_update | The average number of UPDATE statements that are executed per second. | |
Replication Latency | Replica_lag_ms | The replication latency. Unit: milliseconds. |
Blocked Connections | polardbmysql.mdl_lock_session | The number of connections blocked by the MDL lock. |
polardbmysql.other_lock_session | The number of connections blocked by other locks. | |
InnoDB Read/Write Throughput | polardbmysql.innodb_data_read | The average number of bytes that are read from the InnoDB table per second. Unit: KB/s. |
polardbmysql.innodb_data_written | The average number of bytes that are written to the InnoDB table per second. Unit: KB/s. | |
InnoDB Buffer Pool Requests | polardbmysql.innodb_buffer_pool_read_requests | The average number of logical page reads from the InnoDB buffer pool per second. |
polardbmysql.innodb_buffer_pool_write_requests | The average number of page writes to the InnoDB buffer pool per second. | |
InnoDB Buffer Pool Hit Ratio | polardbmysql.innodb_buffer_use_ratio | The InnoDB buffer pool usage. Unit: percentage. Formula: innodb_buffer_pool_pages_data/(innodb_buffer_pool_pages_data + innodb_buffer_pool_pages_free) × 100% |
polardbmysql.innodb_buffer_dirty_ratio | The ratio of dirty pages in the InnoDB buffer pool. Unit: percentage. Formula: Innodb_buffer_pool_pages_dirty/Innodb_buffer_pool_pages_data × 100% | |
polardbmysql.innodb_buffer_read_hit | The read hit ratio of the InnoDB buffer pool. Unit: percentage. Formula: (Innodb_buffer_pool_read_requests - Innodb_buffer_pool_reads)/Innodb_buffer_pool_read_requests × 100% | |
InnoDB Redo Writes | polardbmysql.innodb_log_write_requests | The number of physical writes to the logs per second. |
polardbmysql.innodb_os_log_fsyncs | The number of synchronizations per second. | |
InnoDB Row Operations | polardbmysql.innodb_rows_read | The average number of rows that are read from the InnoDB table per second. |
polardbmysql.innodb_rows_updated | The average number of rows that are updated in the InnoDB table per second. | |
polardbmysql.innodb_rows_inserted | The average number of rows that are inserted into the InnoDB table per second. | |
polardbmysql.innodb_rows_deleted | The average number of rows that are deleted from the InnoDB table per second. | |
PolarDB Storage Space Used | polardbmysql.redolog_size | The storage space occupied by redo logs. Unit: MB. |
polardbmysql.sys_dir_size | The storage space occupied by the system. Unit: MB. | |
polardbmysql.data_size | The storage space occupied by the data. Unit: MB. | |
polardbmysql.other_log_size | The storage space occupied by other logs. Unit: MB. | |
polardbmysql.undolog_size | The storage space occupied by undo logs. Unit: MB. | |
polardbmysql.binlog_size | The storage space occupied by binary logs. Unit: MB. | |
polardbmysql.log_size | The storage space occupied by logs. Unit: MB. | |
polardbmysql.tmp_dir_size | The storage space occupied by temporary files. Unit: MB. | |
PolarDB IOPS | polardbmysql.iops_r | The read IOPS. Unit: counts/s. |
polardbmysql.io_throughput | The total I/O throughput. Unit: MB. | |
polardbmysql.io_throughput_r | The read I/O throughput. Unit: MB. | |
polardbmysql.io_throughput_w | The write I/O throughput. Unit: MB. | |
polardbmysql.iops_w | The write IOPS. Unit: counts/s. | |
polardbmysql.iops | The total IOPS. Unit: counts/s. | |
Com_stmt Status | Com_stmt_execute | The total number of COM_STMT_EXECUTE statements that are executed. |
Com_stmt_reprepare | The total number of COM_STMT_REPREPARE statements that are executed. | |
Com_stmt_send_long_data | The total number of COM_STMT_SEND_LONG_DATA statements that are executed. | |
Com_stmt_reset | The total number of COM_STMT_RESET statements that are executed. | |
Com_stmt_prepare | The total number of COM_STMT_PREPARE statements that are executed. | |
Prepared_stmt_count | The current number of prepared statements. | |
Com_stmt_close | The total number of COM_STMT_CLOSE statements that are executed. | |
Historical Transaction List Length | innodb_trx_history_list_len | The length of the historical transaction list. |