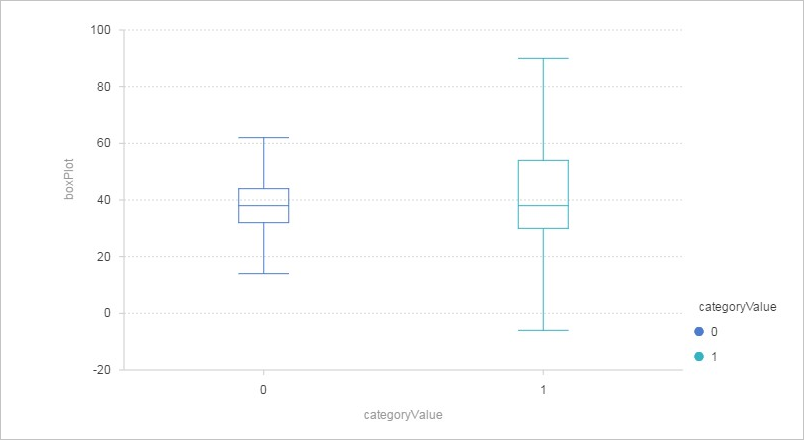
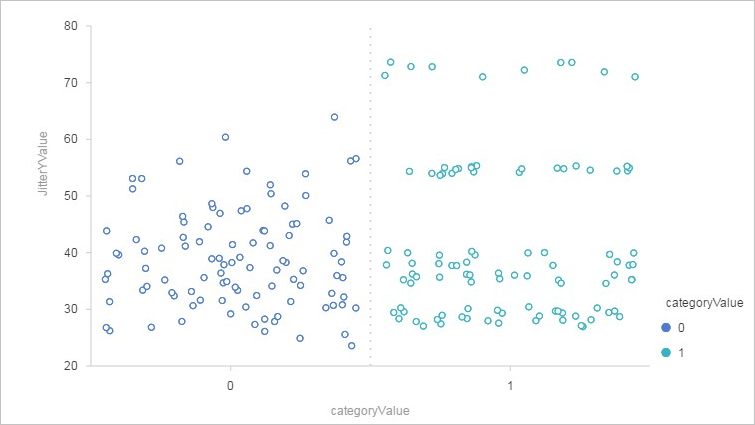
The Box Plot component in Machine Learning Designer visualizes the statistical distribution of a dataset. Use it to inspect how values are spread across a continuous feature, and to compare distributions across groups defined by a categorical feature.
Limitations
The visualized report for this component is available only in Machine Learning Studio.
Configure the component
Method 1: Using the console
On the pipeline configuration page in Machine Learning Designer, set the following parameters under the Field Setting tab.
| Parameter | Description |
|---|---|
| Continuous Features | The column containing the continuous feature to analyze. |
| Enumeration Feature | The column containing the categorical feature. Each unique value in this column produces a separate box plot group, letting you compare distributions across categories. |
| Stratified Samples | The number of adopted stratified samples. |
Note: In Machine Learning Studio, you can select only one field for each parameter. In Machine Learning Designer, you can select multiple fields.
Method 2: Using PAI commands
Run the following PAI command using the SQL Script component.
PAI -name box_plot -project algo_public
    -DinputTable="boxplot"
    -DcontinueCols="age"
    -DcategoryCol="y"
    -DoutputTable="pai_temp_6075_97181_1"
    -DsampleSize="1000"
-Dlifecycle="7";| Parameter | Required | Description | Default |
|---|---|---|---|
inputTable | Yes | Name of the input table. | N/A |
inputTablePartitions | No | Partition to read from the input table. Supported formats: partition_name=value for a single partition, name1=value1/name2=value2 for multi-level partitions. To specify multiple partitions, separate them with commas (,). | N/A |
outputTable | Yes | Name of the output table that stores the box plot chart and samples. | N/A |
continueCols | Yes | The column containing the continuous feature. | N/A |
categoryCol | Yes | The column containing the categorical feature. Each unique value produces a separate box plot group. | N/A |
sampleSize | No | Number of data points sampled per stratum for rendering disturbance points. | 1000 |
lifecycle | No | Lifecycle of the output table. Unit: days. | 28 |
coreNum | No | Number of cores allocated for computation. Must be a positive integer. | Automatically allocated |
memSizePerCore | No | Memory size per core. Valid values: 1–65536. Unit: MB. | Automatically allocated |
Example
Input data
CREATE TABLE boxplot AS SELECT age, y FROM bank_data LIMIT 100;The input table has two columns: age (continuous feature) and y (categorical feature).
| age | y |
|---|---|
| 50 | 0 |
| 53 | 0 |
| 28 | 1 |
| 39 | 0 |
| 55 | 1 |
Parameter settings
Set age as the continuous feature column and y as the categorical feature column. Retain the default values for all other parameters.
Output
To view the output, right-click Box Plot and choose View Data > Output Port.
The output table contains the following columns:
| Column | Description |
|---|---|
percent_points | The calculated percentile values. |
percent_count | The number of data entries in each interval, where intervals are divided by percentile. |
sample_list | Samples selected from each stratum. The sampling rate is calculated as: sampling rate = number of stratified samples / total number of data entries. If the sampling rate is too low and the number of samples in any stratum multiplied by the sampling rate is fewer than 10, the sampling rate is recalculated. |
The component produces two visualizations: