After you import trace data to a trace instance, you can view related data and perform supported operations on the details page of the instance. The data includes the trace details, trace topologies, entry transaction metrics, and slow traces. The operations include the operations to query and analyze log data and the operations to manage Logstores and Metricstores.
Prerequisites
Trace data is imported. For more information, see Import trace data.
Go to the Trace page
Log on to the Simple Log Service console.
In the Log Application section, click Full-stack Observability.
On the page that appears, click the instance that you want to manage.
In the left-side navigation pane of the page that appears, click Trace. Then, choose Overview > Services in the navigation tree that appears.
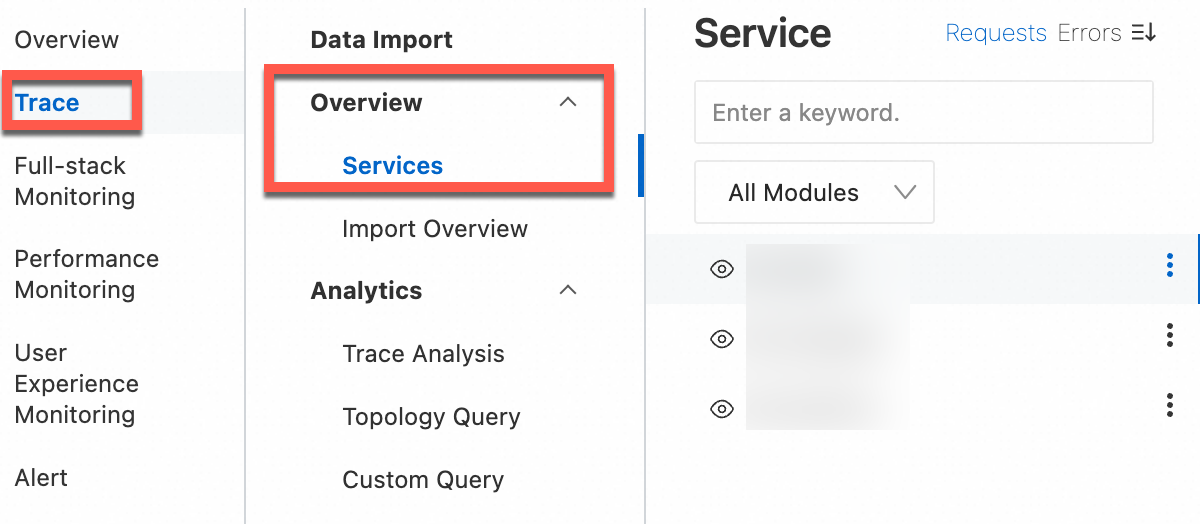
In the service list that appears, click a service to view details, including the average latency, error rate, and queries per second (QPS). By default, the list displays all services of your application.
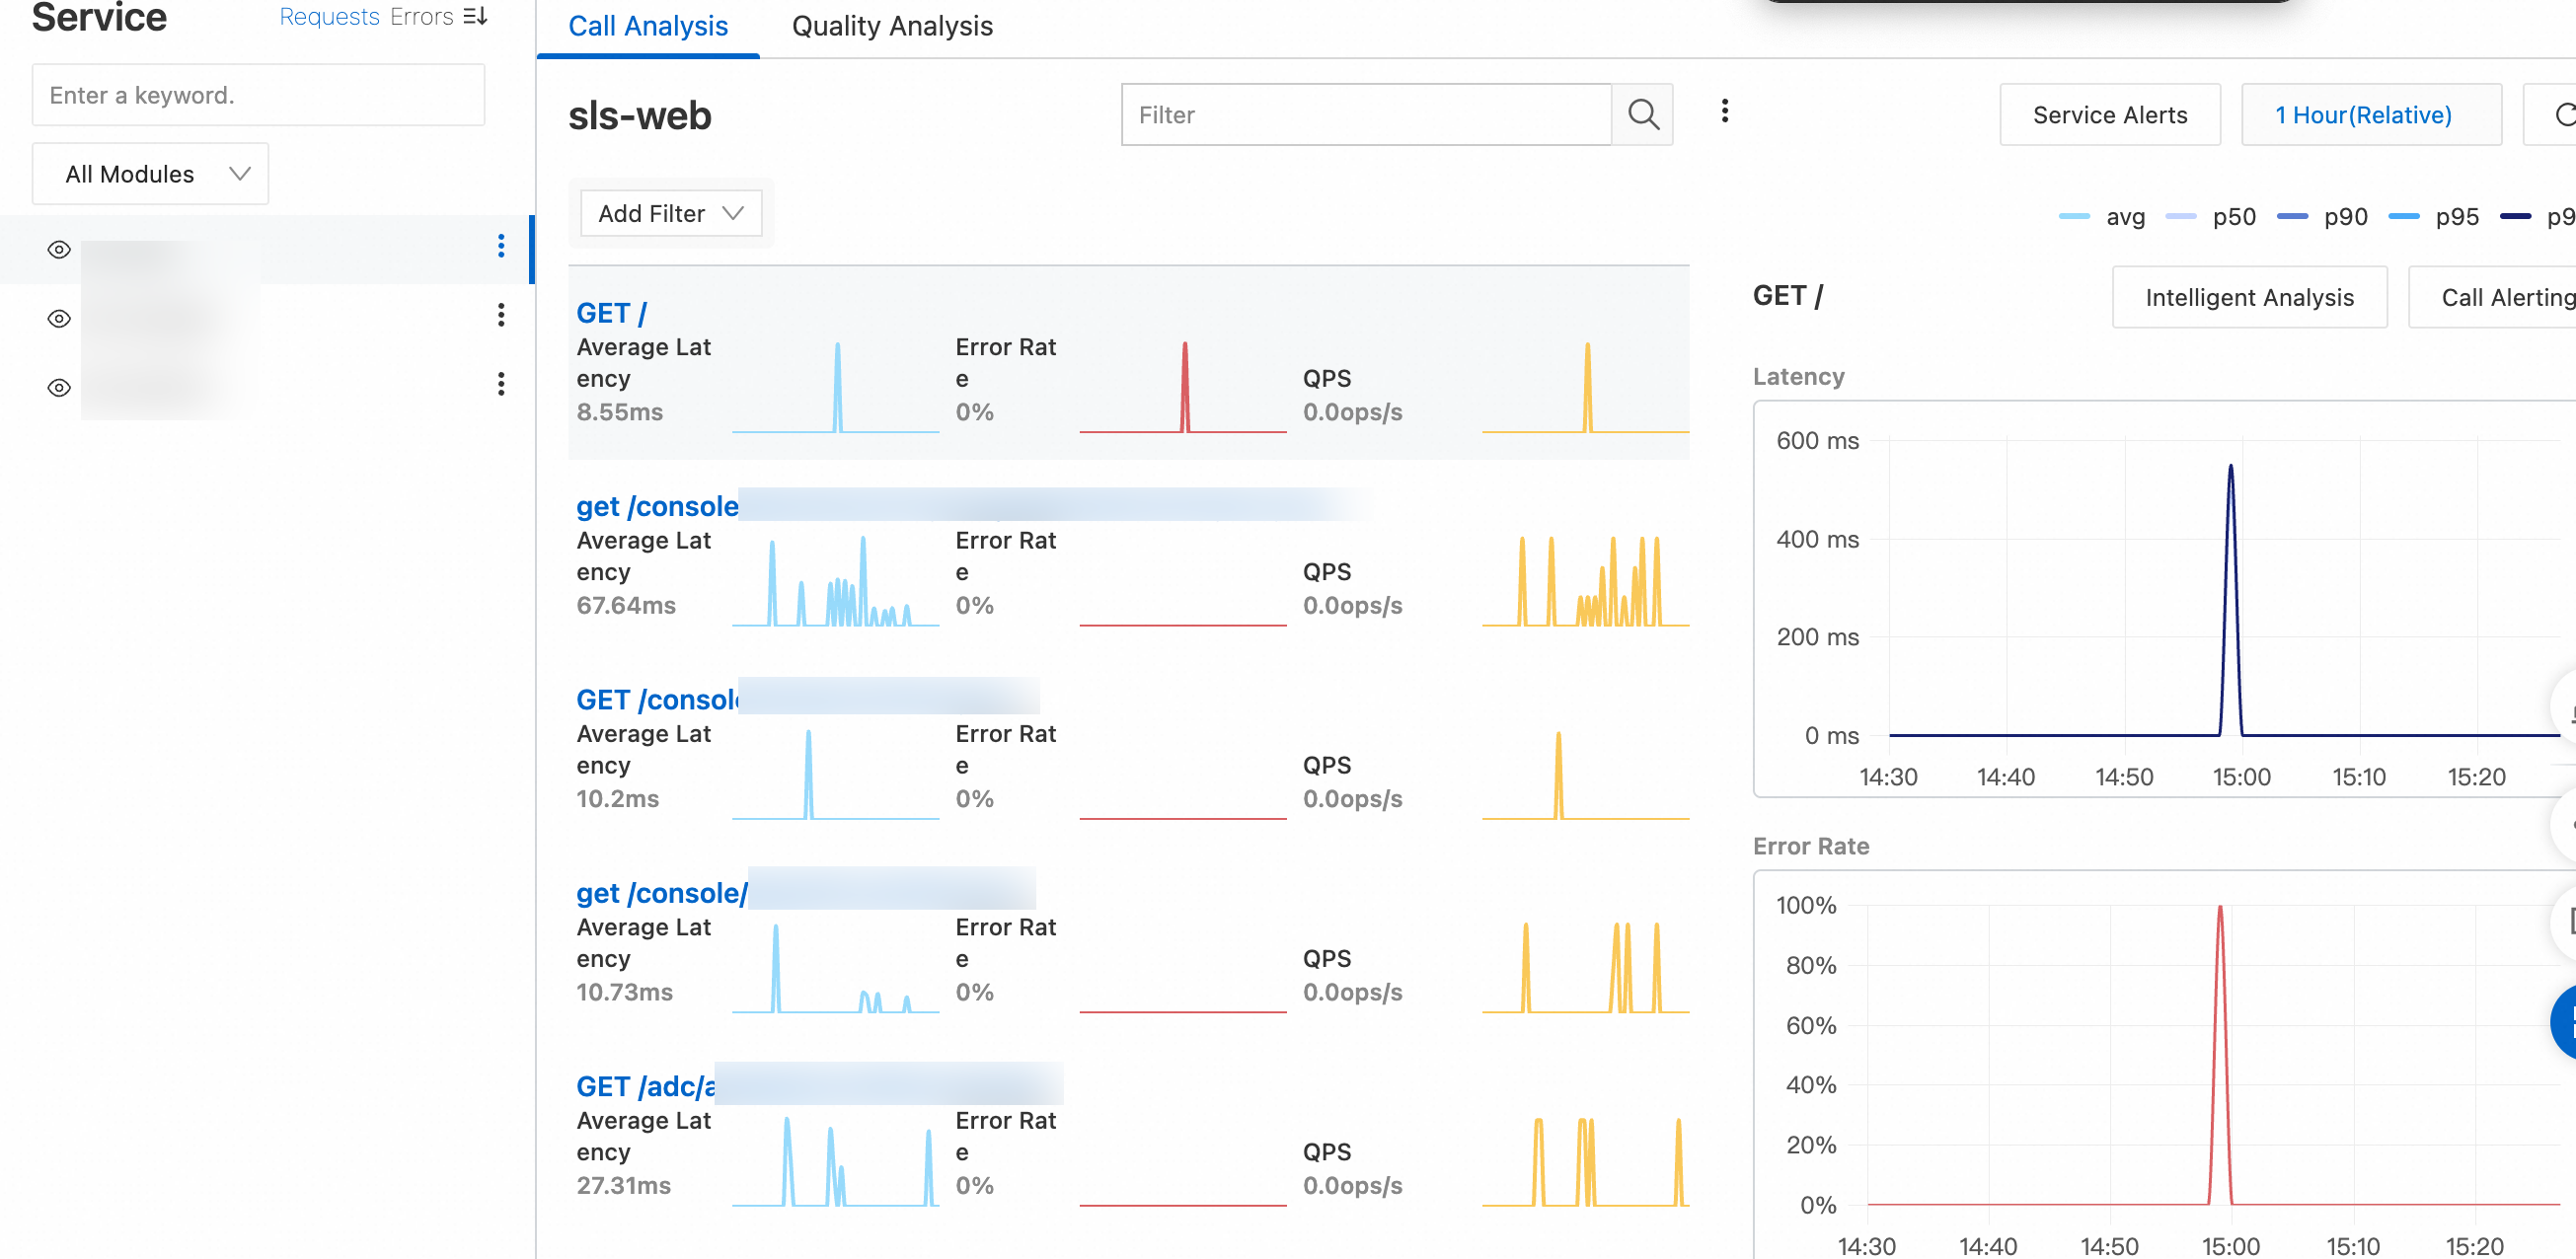
Optional steps:
On the right side of the page, click Service Alerts to configure alerts for service-related metrics, such as Request Count, Error Rate, and Average Latency.
On the right side of the page, click Call Alerting to configure alerts for operation-related metric, such as Request Count, Error Rate, and Avg Latency. The operations are specific to the selected service.
Overview
Import Overview
This page displays the details of imported trace data, including Trace, Span, Service, Method, and Average Latency.
Analytics
Trace Analysis
You can query and analyze the details of a specific trace. For more information, see Query and analyze trace data. In the query results, you can click Quick View or Details in the Trace Details column to view a trace visualization and span details. For more information, see View the details of a trace.
Topology Query
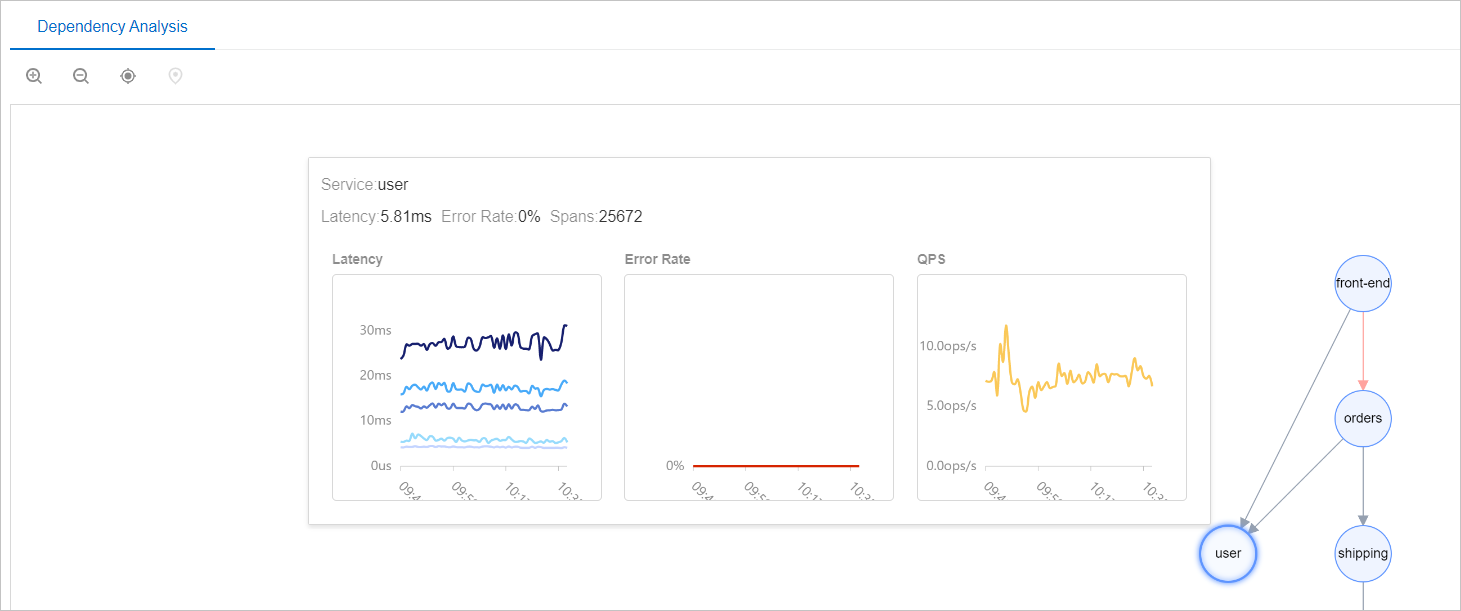
This page displays a service topology that shows dependencies among different services. You can view the service topology on the tab or Topology Query page.
Click a service. The system displays the details of the service, including Average Latency, Error Rate, and Spans.
Custom Query
Raw trace data is collected to a Logstore. You can query and analyze the data in the Logstore. For more information about the formats of trace data, see Trace data formats and Usage notes. For more information about how to query and analyze data, see Query and analyze logs.
Metric Query
You can query and analyze metric data. For more information, see Query and analyze metric data.
Index Search
You can query and analyze log data that is generated during the import of trace data. For more information, see Query and analyze logs.
Analysis Dashboards
Service Overview
You can filter data by service and host and view data in charts, including Request times, Error rate(Entry Transactions), Latency Distribution(Entry Transaction), and Average response time(Entry Transaction).
Entry Transaction Metrics
This page displays the metrics of the service and operation for each entry transaction. The metrics include the number of requests, error rate, average latency, P95 latency, and P99 latency.
Slow Trace Analysis
This page displays the analysis results of traces whose calls last for a long period of time, such as external calls and SQL executions.
Database Analysis
This page displays information about trace-related databases, including Request Times, Average Execute time, and Services.
Management
Statistics
You can view the analysis results of trace data, including Span Count, Average Latency, RequestCount, TOP Service/Method, and TOP Parent/Child Service/Method.
Storage Settings
After you create a trace instance and import trace data to the instance, Simple Log Service automatically generates a Logstore and a Metricstore to store the related data. The Logstore is named in the {instance}-traces format, and the Metricstore is named in the {instance}-metrics format. For more information, see Assets. For more information about how to manage a Logstore, see Manage a Logstore.
References
For more information about the FAQ about log query and analysis, see FAQ.