This topic describes how to ship logs from Simple Log Service (SLS) to Splunk using the Alibaba Cloud Log Service Add-on for Splunk.
How it works
The data flow is as follows:
The add-on uses Splunk data inputs to create and manage consumer groups that consume logs from SLS in real time.
Splunk heavy forwarders use the Splunk private protocol or HTTP Event Collector (HEC) to forward the logs to Splunk indexers.
This is a data collection add-on and must be installed only on Splunk heavy forwarders. Do not install it on indexers or search heads.

Terms

A data input is a consumer that consumes logs.
A consumer group contains multiple consumers. Each consumer in a consumer group consumes different logs stored in a logstore.
A logstore contains multiple shards.
Each shard can be allocated to only one consumer.
A consumer can consume data from multiple shards.
Consumer name is a unique identifier for each consumer, automatically generated by combining the consumer group name, hostname, process ID, and protocol. This ensures no two consumers in the same group have the same name.
For more information about consumer groups, see Use consumer groups to consume logs.
Prerequisites
Obtain an AccessKey pair used to access SLS.
Use the AccessKey pair of a Resource Access Management (RAM) user to access an SLS project. For more information, see AccessKey pair.
Use the permission assistant to grant permissions to a RAM user. The following example shows a common policy.
NoteReplace <Project name> and <Logstore name> with your actual project and logstore names. Wildcards (*) are supported.
{
  "Version": "1",
  "Statement": [
    {
      "Action": [
        "log:ListShards",
        "log:GetCursorOrData",
        "log:GetConsumerGroupCheckPoint",
        "log:UpdateConsumerGroup",
        "log:ConsumerGroupHeartBeat",
        "log:ConsumerGroupUpdateCheckPoint",
        "log:ListConsumerGroup",
        "log:CreateConsumerGroup"
      ],
      "Resource": [
        "acs:log:*:*:project/<Project name>/logstore/<Logstore name>",
        "acs:log:*:*:project/<Project name>/logstore/<Logstore name>/*"
      ],
      "Effect": "Allow"
    }
  ]
}
Ensure your environment meets the following requirements:
The latest version of the add-on is used.
The operating system is Linux, macOS, or Windows.
The version of Splunk heavy forwarders is 8.0 or later and the version of Splunk indexers is 7.0 or later.
If you use HEC to send events to Splunk indexers, ensure that HEC is configured on Splunk. If you use the Splunk private protocol to send events to Splunk indexers, skip this step.
NoteWhen you create an HEC token, do not enable the indexer acknowledgment feature for the token.
Install the add-on
Log on to the Splunk web interface and install the add-on. To install the add-on, we recommend that you use one of the following methods.
The add-on is used to only collect data. You must install the add-on on Splunk heavy forwarders. You do not need to install the add-on on Splunk indexers or search heads.
Method 1
Click the
 icon.
icon. On the Apps page, click Find More Apps.
On the Browse More Apps page, search for Alibaba Cloud Log Service Add-on for Splunk and click Install.
After the add-on is installed, restart Splunk as prompted.
Method 2
Click the
icon. On the Apps page, click Install app from file.
On the Upload app page, select the TGZ file that you want to upload and click Upload.
Click App Search Results and download the required TGZ file.
Click Install.
After the add-on is installed, restart Splunk as prompted.
Configure the add-on
If Splunk is not running on an Elastic Compute Service (ECS) instance, use an AccessKey pair of your Alibaba Cloud account to access SLS.
On the Splunk web interface, click Alibaba Cloud Log Service Add-on for Splunk.
Configure a global account.
On the page that appears, choose . On the Configuration page, click the Account tab. On this tab, click Add. In the Add Account dialog box, specify an AccessKey pair that can be used to access SLS.
NoteThe fields are mapped as follows:
Username: Your AccessKey ID.
Password: Your AccessKey secret.
Specify the level of add-on logs.
Choose . On the Configuration page, click the Logging tab. On this tab, select a level from the Log level drop-down list.
Create a data input.
Click inputs to open the inputs page.
Click Create New Input. In the Add sls_datainput dialog box, configure the parameters of a data input.
Table 1. Parameters of a data input
Parameter
Required and data type
Description
Example
Name
Yes, string
The name of the data input. It must be globally unique.
None.
Interval
Yes, integer
The period of time required to restart the Splunk data input process after the process stops. Unit: seconds.
Default value: 10.
Index
Yes, string
The Splunk index.
None.
SLS AccessKey
Yes, string
The Alibaba Cloud AccessKey pair that consists of an AccessKey ID and an AccessKey secret.
NoteYou must enter an AccessKey ID in the Username field and the related AccessKey secret in the Password field.
The AccessKey pair that you enter when configuring the global account.
SLS endpoint
Yes, string
The SLS endpoint.
cn-huhehaote.log.aliyuncs.com
https://cn-huhehaote.log.aliyuncs.com
SLS project
Yes, string
The name of the SLS project. For more information, see Manage projects.
None.
SLS logstore
Yes, string
The name of the SLS logstore. For more information, see Manage a logstore.
None.
SLS consumer group
Yes, string
The name of the SLS consumer group. If you want to use multiple data inputs to consume data stored in the same logstore, you must specify the same consumer group name for the data inputs. For more information, see Use consumer groups to consume logs.
None.
SLS cursor start time
Yes, string
The start time of log data consumption. This parameter is valid only when you use a new consumer group. If you use an existing consumer group, data is consumed from the last checkpoint.
NoteThe start time is the log receiving time.
Valid values: begin, end, and a time value in the ISO 8601 format. Example: 2018-12-26 0:0:0+8:00.
SLS heartbeat interval
Yes, integer
The interval at which a heartbeat message is sent between the consumer and the server. Unit: seconds.
Default value: 60.
SLS data fetch interval
Yes, integer
The interval at which logs are pulled from SLS. If logs are generated at a low frequency, we recommend that you do not set this parameter to a small value. Unit: seconds.
Default value: 1.
consume_processor
No, string
You must first create a consumer processor that contains SPL (for example, consume-processor-1) in your project. This processor is supported only on the Linux x86_64 platform. For more information, see Manage consumer processors.
None.
Topic filter
No, string
A semicolon-separated list of topics to ignore. Logs with a matching topic will not be sent to Splunk.
TopicA;TopicB. The value specifies that logs whose topic is TopicA or TopicB are ignored.
Unfolded fields
No, JSON
The mapping relationship between the topic of a log in the JSON format and a list of fields. {"topicA": ["field_nameA1", "field_nameA2", ...], "topicB": ["field_nameB1", "field_nameB2", ...], ...}
{"actiontrail_audit_event": ["event"] }. The value specifies that in a log whose topic is actiontrail_audit_event, the JSON strings of the specified fields are expanded and stored in the event field.
Event source
No, string
The source of Splunk events.
None.
Event source type
No, string
The type of the source for Splunk events.
None.
Event retry times
No, integer
The number of retries to consume log data.
Default value: 0, which specifies unlimited retries.
Event protocol
Yes, string
The protocol used to send Splunk events. If you use the Splunk private protocol to send Splunk events, you do not need to configure the following parameters in the table.
HTTP for HEC
HTTPS for HEC
Private protocol
HEC host
Yes, string
The HEC host. This parameter is valid only if you use HEC to send Splunk events. For more information, see Set up and use HTTP Event Collector in Splunk Web.
None.
HEC port
Yes, integer
The HEC port. This parameter is valid only if you use HEC to send Splunk events.
None.
HEC token
Yes, string
The HEC token. This parameter is valid only if you use HEC to send Splunk events. For more information, see HEC token.
None.
HEC timeout
Yes, integer
The HEC timeout period. This parameter is valid only if you use HEC to send Splunk events. Unit: seconds.
Default value: 120.
If Splunk is running on an ECS instance, attach a RAM role to the ECS instance. Then, the ECS instance can assume the RAM role to access SLS. Procedure:
Ensure that Splunk is running on the ECS instance to which the required RAM role is attached.
Attach a RAM role to an ECS instance.
In this step, create a RAM role, grant permissions to the RAM role, and then attach the RAM role to an ECS instance. For more information, see Configure an instance RAM role.
For more information about the policy of the RAM role, see the policy in Prerequisites.
On the Splunk web interface, click Alibaba Cloud Log Service Add-on for Splunk.
Configure a global account.
On the page that appears, choose . On the Configuration page, click the Account tab. On this tab, click Add. In the Add Account dialog box, specify the RAM role attached to the ECS instance. In this example, enter ECS_RAM_ROLE in the Username field and enter the name of the RAM role created in Step 1 in the Password field.
Create a data input.
Click inputs to open the inputs page.
Click Create New Input. In the Add sls_datainput dialog box, configure the parameters of a data input.
You must set the SLS AccessKey parameter to the global account created in Step 3. For more information about other parameters, see Parameters of a data input.
Related operations
Query data
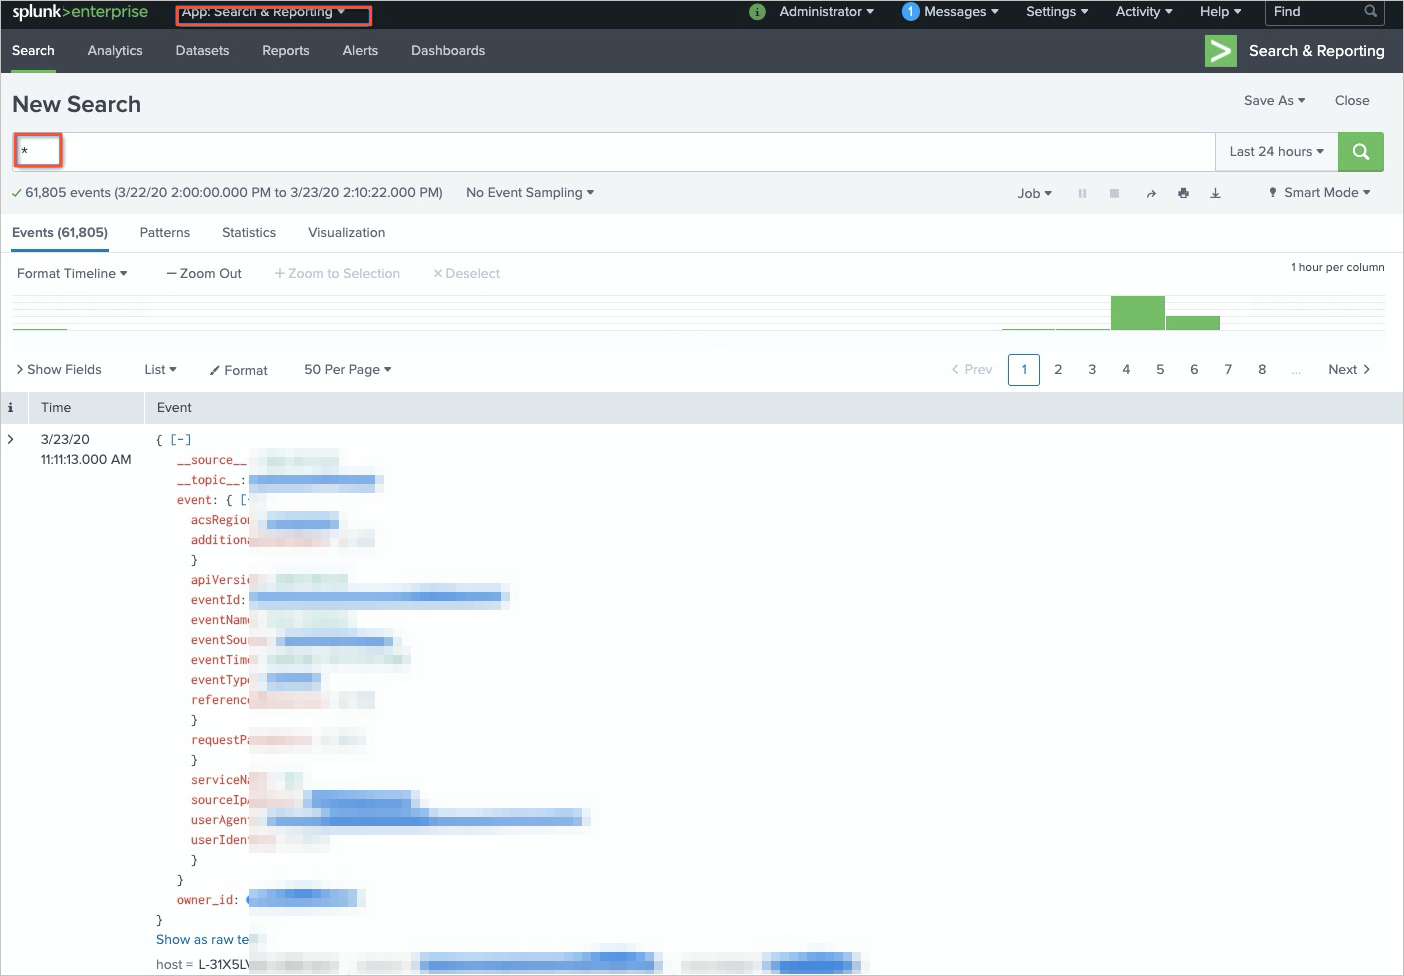
Ensure that the data input is in the Enabled state. On the Splunk web interface, click Search & Reporting. On the App: Search & Reporting page, query the collected audit logs.
Query SLS operational logs
Enter
index="_internal" | search "SLS info"in the search box to query the info logs of SLS.Enter
index="_internal" | search "error"in the search box to query the error logs of SLS.
Performance and security
Performance
The performance of the add-on and data transmission throughput vary based on the following factors:
Endpoint: Access SLS using a public, classic network, virtual private cloud (VPC), or global acceleration endpoint. In most cases, we recommend that you use a classic network endpoint or a VPC endpoint. For more information, see Endpoints.
Bandwidth: The bandwidth of data transmission between SLS and Splunk heavy forwarders and between Splunk heavy forwarders and indexers affects the performance.
Processing capability of Splunk indexers: The capabilities of indexers to receive data from Splunk heavy forwarders affect the performance.
Number of shards: A larger number of shards in a logstore indicates a higher data transmission capability. You must specify the number of shards based on the speed at which raw logs are generated. For more information, see Manage shards.
Number of Splunk data inputs: A larger number of data inputs in a consumer group configured for a logstore indicates a higher throughput.
NoteThe concurrent consumption of log data varies based on the number of shards in a logstore.
Resource consumption: As a general guideline, each data input consumes approximately 1 CPU core and 1-2 GB of memory on the heavy forwarder.
With sufficient resources, a single data input can achieve a throughput of 1-2 MB/s. You must specify the number of shards based on the speed at which raw logs are generated.
For example, if logs are written to a logstore at a speed of 10 MB per second, you must create at least 10 shards in the logstore and configure 10 data inputs in the add-on. If you deploy the add-on on a single server, ensure that the server has 10 idle CPU cores and 12 GB of available memory resources.
High availability
A consumer group stores checkpoints on the server side. When a consumer stops consuming data, another consumer continues to consume data from the last checkpoint. You can create Splunk data inputs on multiple servers. If a server stops running or is damaged, a Splunk data input on another server continues to consume data from the last checkpoint. In theory, the number of Splunk data inputs launched on multiple servers can be greater than the number of shards, which ensures that data is consumed from the last checkpoint if an exception occurs.
HTTPS-based data transmission
SLS
To use HTTPS to encrypt the data transmitted between your program and SLS, ensure that your endpoint is prefixed with https://. Example: https://cn-beijing.log.aliyuncs.com.
The *.aliyuncs.com server certificate is issued by GlobalSign. By default, most Linux and Windows servers are preconfigured to trust this certificate. If a server does not trust this certificate, see Install a trusted root CA or self-signed certificate.
Splunk
To use HTTPS-based HEC, enable the SSL feature when you enable HEC in the Global Settings dialog box. For more information, see Configure HTTP Event Collector on Splunk Enterprise.
AccessKey pair storage protection
The AccessKey pair that you use to access SLS and HEC tokens are encrypted and stored in Splunk. This prevents data leaks.
FAQs
What do I do if a configuration error occurs?
A configuration error may occur in a data input when you create or modify the data input. In this case, check the basic configuration of the data input. For more information about parameters, see Parameters of a data input.
A configuration error may occur in SLS. For example, the system failed to create a consumer group. In this case, check the configuration of SLS.
Command:
index="_internal" | search "error"Error log:
aliyun.log.consumer.exceptions.ClientWorkerException:
error occour when create consumer group,
errorCode: LogStoreNotExist,
errorMessage: logstore xxxx does not exist
ConsumerGroupQuotaExceed error
You can configure up to 20 consumer groups for a logstore. We recommend that you view consumer groups in the SLS console and delete the consumer groups that are no longer required. If more than 20 consumer groups are configured for a logstore, the ConsumerGroupQuotaExceed error is reported.
What do I do if a permission error occurs?
You are not authorized to access SLS. Check your permissions.
Command:
index="_internal" | search "error"Error log:
aliyun.log.consumer.exceptions.ClientWorkerException:
error occour when create consumer group,
errorCode: SignatureNotMatch,
errorMessage: signature J70VwxYH0+W/AciA4BdkuWxK6W8= not match
RAM authentication for your ECS instance failed.
Command:
index="_internal" | search "error"Error log:
ECS RAM Role detected in user config, but failed to get ECS RAM credentials. Please check if ECS instance and RAM role 'ECS-Role' are configured appropriately.ECS-Role is the RAM role that you create. The ECS-Role variable is displayed as the actual value.
Troubleshooting:
Check whether the SLS AccessKey parameter of your data input is configured as the global account that has a RAM role.
Check whether the RAM role is properly configured for the global account. The username must be set to ECS_RAM_ROLE, and the password must be set to the name of the RAM role.
Check whether the RAM role is attached to the ECS instance.
Check whether the trusted entity type of the RAM role is set to Alibaba Cloud Service. Check whether the selected trusted service is ECS.
Check whether the ECS instance to which the RAM role is attached is the ECS instance on which Splunk is running.
You are not authorized to access HEC.
Command:
index="_internal" | search "error"Error log:
ERROR HttpInputDataHandler - Failed processing http input, token name=n/a, channel=n/a, source_IP=127.0.0.1, reply=4, events_processed=0, http_input_body_size=369

WARNING pid=48412 tid=ThreadPoolExecutor-0_1 file=base_modinput.py:log_warning:302 |
SLS info: Failed to write [{"event": "{\"__topic__\": \"topic_test0\", \"__source__\": \"127.0.0.1\", \"__tag__:__client_ip__\": \"10.10.10.10\", \"__tag__:__receive_time__\": \"1584945639\", \"content\": \"goroutine id [0, 1584945637]\", \"content2\": \"num[9], time[2020-03-23 14:40:37|1584945637]\"}", "index": "main", "source": "sls log", "sourcetype": "http of hec", "time": "1584945637"}] remote Splunk server (http://127.0.0.1:8088/services/collector) using hec.
Exception: 403 Client Error: Forbidden for url: http://127.0.0.1:8088/services/collector, times: 3
Possible causes:
HEC is not configured or started.
The HEC-related parameters of data inputs are invalid. For example, if you use HTTPS-based HEC, you must enable the SSL feature.
The indexer acknowledgment feature is disabled for your HEC tokens.
How to resolve consumption latency?
Check the status of your consumer group in the SLS console.
We recommend that you increase the number of shards or create more data inputs in the same consumer group. For more information, see Performance and security.
What do I do if network jitter occurs?
Command:
index="_internal" | search "SLS info: Failed to write"Error log:
WARNING pid=58837 tid=ThreadPoolExecutor-0_0 file=base_modinput.py:log_warning:302 |
SLS info: Failed to write [{"event": "{\"__topic__\": \"topic_test0\", \"__source__\": \"127.0.0.1\", \"__tag__:__client_ip__\": \"10.10.10.10\", \"__tag__:__receive_time__\": \"1584951417\", \"content2\": \"num[999], time[2020-03-23 16:16:57|1584951417]\", \"content\": \"goroutine id [0, 1584951315]\"}", "index": "main", "source": "sls log", "sourcetype": "http of hec", "time": "1584951417"}] remote Splunk server (http://127.0.0.1:8088/services/collector) using hec.
Exception: ('Connection aborted.', ConnectionResetError(54, 'Connection reset by peer')), times: 3
If network jitter occurs, Splunk events are automatically retransmitted. If the issue persists, contact your network administrator.
How do I change the start time of consumption?
NoteThe SLS cursor start time parameter is valid only when you use a new consumer group. If you use an existing consumer group, data is consumed from the last checkpoint.
On the inputs page of the Splunk web interface, disable the related data input.
Log on to the Simple Log Service console. Find the logstore from which data is consumed and delete the related consumer group in the Data Consumption section.
On the inputs page of the Splunk web interface, find the data input, and choose . In the dialog box that appears, modify the SLS cursor start time parameter. Then, enable the data input.