Simple Log Service provides a project monitoring dashboard for each project to monitor projects.
Prerequisites
The metric collection feature is enabled by using CloudLens for SLS. For more information, see Enable the log collection feature.
You can view only data that is generated after you enable the metric collection feature.
Procedure
On a project monitoring dashboard, you can query and analyze only the data that is generated within the previous 30 days.
Log on to the Simple Log Service console.
In the Projects section, click the project that you want to manage.

In the upper-left corner of the page that appears, choose
 > Project Monitoring.
 View the charts on the project monitoring dashboard.
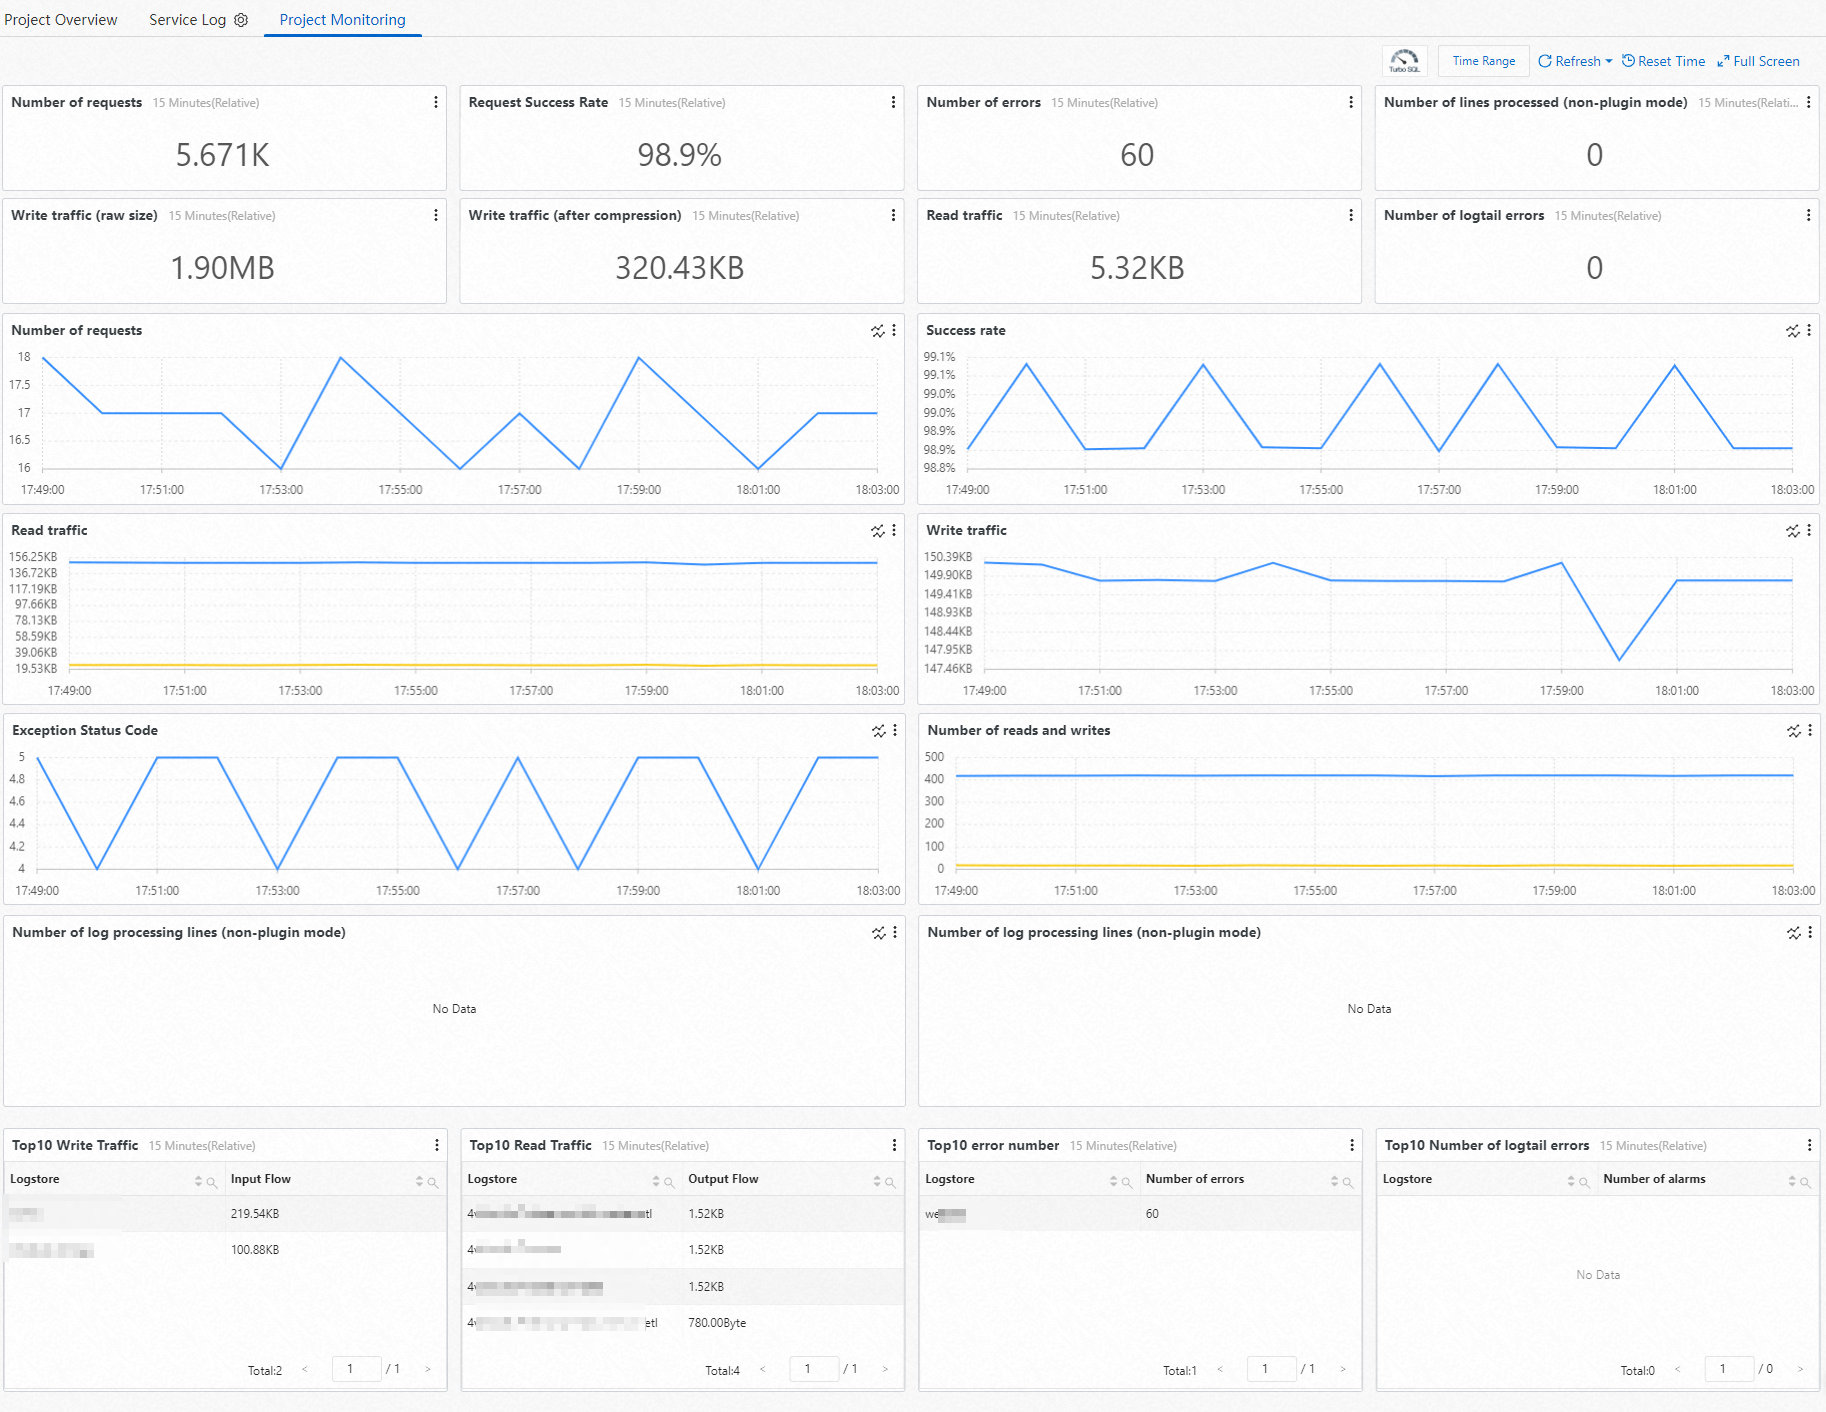
The single value charts display the following metrics: Number of requests, Request Success Rate, Requests with Status Code 4xx, Requests with Status Code 5xx, Write traffic (raw size), Write traffic (after compression), Write traffic compression ratio, and Read Traffic.
The line charts display the trends of the following metrics: Traffic, Number of write requests, Number of read requests, Number of search requests, Write success rate, Read success rate, Search success rate, IPs, Avg Latency, and P95 Latency.
The tables display the projects and Logstores that correspond to the following metrics: Project Write Traffic Top 10, Project Read Traffic Top 10, and Avg Write Latency(millisecond) Top 10.