CloudMonitor monitors Alibaba Cloud resources and Internet applications and triggers alerts based on alert rules. Alerts are classified into threshold alerts and event alerts. CloudMonitor supports multiple alert notification methods. You can configure the alert ingestion system of Log Service as a notification method in the CloudMonitor console. This way, CloudMonitor alerts can be ingested into Log Service. Then, the alerting system of Log Service denoises the alerts and sends alert notifications.
Prerequisites
- An alert ingestion application is created. The Protocol parameter of the alert ingestion application is set to CloudMonitor. For more information, see Configure webhook URLs for alert ingestion.
- An alert contact and an alert contact group are created. The alert contact is added to the alert contact group. For more information, see Create an alert contact or alert contact group.
Configure the alert contact and an alert notification method in the CloudMonitor console
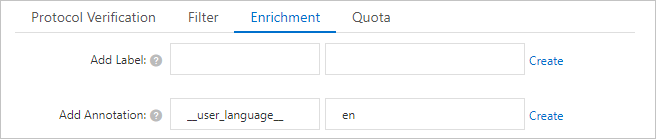
Specify a language for alerts
Mappings of alert severities
The following table describes the mappings between the alert severities in CloudMonitor and the alert severities in Log Service.
| CloudMonitor | Log Service |
|---|---|
| CRITICAL | critical |
| WARN | medium |
| INFO | info |
Threshold alert parsing
After a CloudMonitor threshold alert is ingested into the alerting system of Log Service, Log Service generates a corresponding alert. The following examples show the mappings between the two alerts:
- Example of a CloudMonitor threshold alert
For more information about CloudMonitor threshold alerts, see Use the alert callback feature to send notifications about threshold-triggered alerts.
{ "alertName": "Connections", "alertState": "ALERT", "curValue": "4.5", "dimensions": "{instanceId=i-bp1d7111111115htda, state=TCP_TOTAL, userId=11596111111355}", "expression": "$Average>=1", "instanceName": "launch-advisor-20210607/11.**.***.111", "lastTime": "27 days, 19 hours, and 47 minutes", "metricName": "Host.tcpconnection", "metricProject": "acs_ecs", "namespace": "acs_ecs", "preTriggerLevel": "WARN", "productGroupName": "null", "rawMetricName": "net_tcpconnection", "regionId": "cn-hangzhou", "regionName": "China (Hangzhou)", "ruleId": "i-bp11111111115111_111111-0703-4811-9113-1c1111111111", "signature": "F111111w1111qN1111bw=", "timestamp": "1625455812126", "triggerLevel": "WARN", "userId": "11596111111355" } - Example of a Log Service alert
After a CloudMonitor threshold alert is ingested into Log Service, the alert is converted to an alert that is supported by Log Service by using field mapping. The following example shows the content of a Log Service alert:
{ "aliuid": "aliuid1", "alert_instance_id": "", "alert_id": "i-bp11111111115111_111111-0703-4811-9113-1c1111111111", "alert_type": "sls_pub", "alert_name": "Connections", "region": "cn-hangzhou", "project": "sls-alert--", "project_id": 0, "next_eval_interval": 0, "alert_time": 1625455812, "fire_time": 1625455812, "fire_results": null, "fire_results_count": 0, "resolve_time": 0, "status": "firing", "results": null, "labels": { "instanceId": "i-bp1d7111111115htda", "namespace": "acs_ecs", "regionId": "cn-hangzhou", "state": "TCP_TOTAL", "userId": "11596111111355" }, "annotations": { "__cloud_monitor_type__": "threshold", "__config_app__": "sls_pub_alert", "__pub_alert_app__": "appid1", "__pub_alert_protocol__": "cloud_monitor", "__pub_alert_region__": "e", "__pub_alert_service__": "serverid1", "curValue": "4.5", "desc": "Host.tcpconnection $Average>=1 lasts for: 27 days, 19 hours, and 47 minutes. Details: {instanceId=i-bp1d7111111115htda, state=TCP_TOTAL, userId=11596111111355}", "expression": "$Average\u003e=1", "instanceName": "launch-advisor-20210607/11.**.**.1111", "lastTime": "27 days, 19 hours, and 47 minutes", "metricName": "Host.tcpconnection", "metricProject": "acs_ecs", "namespace": "acs_ecs", "preTriggerLevel": "WARN", "rawMetricName": "net_tcpconnection", "title": "acs_ecs Host.tcpconnection Current value: 4.5" }, "severity": 6, "policy": { "alert_policy_id": "", "action_policy_id": "", "use_default": false, "repeat_interval": "0s" }, "template": null, "drill_down_query": "https://cloudmonitor.console.alibabacloud.com/index.htm#/alarmInfo/name=i-bp11111111115111_111111-0703-4811-9113-1c1111111111\u0026searchValue=\u0026searchType=name\u0026searchProduct=/history//" } - Field mappings
The following table describes the mappings between the alert attributes of Log Service and the alert fields of CloudMonitor.
Log Service CloudMonitor Description aliuid None The ID of the Alibaba Cloud account to which the alert ingestion application belongs. alert_id ruleId The ID of the alert monitoring rule. alert_type None The type of the alert. Valid value: sls_pub. alert_name alertName The name of the alert monitoring rule. status alertState The status of the alert. - If the value of the alertState field in the CloudMonitor alert is OK, the value of the status field in Log Service is resolved.
- If the value of the alertState field in the CloudMonitor alert is not OK, for example, alerting, the value of the status field in Log Service is firing.
next_eval_interval None The interval at which the alert is evaluated. Valid value: 0. alert_time timestamp The time when Log Service receives the CloudMonitor alert. fire_time timestamp The time when Log Service receives the CloudMonitor alert. resolve_time None The time when the alert is cleared. If the value of the alertState field is OK, the value of the resolve_time field is the current time. If the value of the status field is not OK, the value of the resolve_time field is 0. labels dimensions The labels of the alert. - The regionId field is mapped to the regionId field in the CloudMonitor alert.
- The namespace field is mapped to the namespace field or the metricProject field in the CloudMonitor alert.
Note If you add a label on the Enrichment tab when you create the alert ingestion application, the label is added to the labels field.annotations None After the CloudMonitor alert is ingested into Log Service, the following fields are added to the annotations field of the corresponding Log Service alert: - __cloud_monitor_type__: "threshold"
- __config_app__: "sls_pub_alert"
- __pub_alert_service__: {The ID of the alert ingestion service}
- __pub_alert_app__: {The ID of the alert ingestion application}
- __pub_alert_protocol__: "cloud_monitor"
- __pub_alert_region__: {The region of the endpoint to which the alert is sent}
After the CloudMonitor alert is ingested into Log Service, the following fields are not added to the annotations field of the corresponding Log Service alert: ruleId, alertName, alertState, dimensions, signature, timestamp, regionId, regionName, triggerLevel, and userId.
Note If you add an annotation on the Enrichment tab when you create the alert ingestion application, the annotation is added to the annotations field.severity triggerLevel and preTriggerLevel The severity of the alert. For more information, see Severity levels. policy None The alert policy that is specified for the alert ingestion application. For more information, see Description of the policy variable. project None The project to which Alert Center belongs. For more information, see Project. region regionId The region to which the project belongs. drill_down_query None The value is a link. The link consists of the URL of the CloudMonitor console and the value of the ruleId field. You can click the link to go to the Alert History page of the CloudMonitor console.
Event alert parsing
After a CloudMonitor event alert is ingested into the alerting system of Log Service, Log Service generates a corresponding alert. The following examples show the mappings between the two alerts.
- Example of a CloudMonitor event alert
For more information about CloudMonitor event alerts, see Configure callbacks for system event-triggered alerts.
{ "traceId": "411112-c49d-4143-a38e-c111159e-0", "resourceId": "acs:ecs:cn-hangzhou:115111111111355:instance/i-bp1d71111111x15htda", "product": "ECS", "ver": "1.0", "instanceName": "launch-advisor-20210607", "level": "INFO", "userId": "115111111111355", "content": { "resourceId": "i-bp1d7411111111g111htda", "publicIpAddress": "127.0.0.1", "instanceName": "launch-advisor-20210607", "state": "Running", "privateIpAddress": "127.0.0.1", "resourceType": "ALIYUN::ECS::Instance" }, "regionId": "cn-hangzhou", "eventTime": "20210705T113013.398+0800", "name": "Instance:StateChange", "id": "26111205-51113-4D118-8119-3111113CB735", "timeMetrics": { "ingestion_in_time": 1625455813563, "ingestion_out_time": 1625455816000, "notify_in_time": 1625455819578, "engine_in_time": 1625455816467, "event_time": 1625455813398, "engine_out_time": 1625455818000 }, "status": "Normal" } - Example of a Log Service alert
After a CloudMonitor event alert is ingested into Log Service, the alert is converted to an alert that is supported by Log Service by using field mapping. The following example shows the content of a Log Service alert:
{ "aliuid": "aliuid1", "alert_instance_id": "26111205-51113-4D118-8119-3111113CB735", "alert_id": "Instance:StateChange", "alert_type": "sls_pub", "alert_name": "Instance:StateChange", "region": "cn-hangzhou", "project": "sls-alert--", "project_id": 0, "next_eval_interval": 0, "alert_time": 1625455813, "fire_time": 1625743445, "fire_results": null, "fire_results_count": 0, "resolve_time": 0, "status": "firing", "results": null, "labels": { "resourceId": "acs:ecs:cn-hangzhou:115111111111355:instance/i-bp1d71111111x15htda" }, "annotations": { "__cloud_monitor_type__": "event", "__config_app__": "sls_pub_alert", "__pub_alert_app__": "appid1", "__pub_alert_protocol__": "cloud_monitor", "__pub_alert_region__": "e", "__pub_alert_service__": "serverid1", "content_instanceName": "launch-advisor-20210607", "content_privateIpAddress": "127.0.0.1", "content_publicIpAddress": "127.0.0.1", "content_resourceId": "i-bp1d7411111111g111htda", "content_resourceType": "ALIYUN::ECS::Instance", "content_state": "Running", "desc": "The Instance:StateChange event alert is triggered. Details: {\"instanceName\":\"launch-advisor-20210607\",\"privateIpAddress\":\"127.0.0.1\",\"publicIpAddress\":\"127.0.0.1\",\"resourceId\":\"i-bp1d7411111111g111htda\",\"resourceType\":\"ALIYUN::ECS::Instance\",\"state\":\"Running\"}", "instanceName": "launch-advisor-20210607", "level": "INFO", "product": "ECS", "status": "Normal", "title": "Instance:StateChange: Normal", "traceId": "411112-c49d-4143-a38e-c111159e-0", "userId": "115111111111355" }, "severity": 4, "policy": { "alert_policy_id": "", "action_policy_id": "", "use_default": false, "repeat_interval": "0s" }, "template": null, "drill_down_query": "https://cloudmonitor.console.alibabacloud.com/index.htm#/eventmonitoring/events/detail?product=ECS\u0026eventName=Instance:StateChange" } - Field mappings
The following table describes the mappings between the alert attributes of Log Service and the alert fields of CloudMonitor.
Log Service CloudMonitor Description aliuid None The ID of the Alibaba Cloud account to which the alert ingestion application belongs. alert_instance_id id The ID of the alert. alert_id name The name of the alert monitoring rule. alert_type None The type of the alert. Valid value: sls_pub. alert_name name The name of the alert monitoring rule. status None The status of the alert. Valid value: firing. next_eval_interval None The interval at which the alert is evaluated. Valid value: 0. alert_time None The time when Log Service receives the CloudMonitor alert. fire_time eventTime The value of the eventTime field is parsed and converted to a timestamp. resolve_time None The time when the alert is cleared. Valid value: 0. labels None The labels of the alert. The regionId field is mapped to the regionId field in the CloudMonitor alert.
Note If you add a label on the Enrichment tab when you create the alert ingestion application, the label is added to the labels field.annotations None After the CloudMonitor alert is ingested into Log Service, the following fields are added to the annotations field of the corresponding Log Service alert: - __cloud_monitor_type__: "event"
- __config_app__: "sls_pub_alert"
- _pub_alert_service__: {The ID of the alert ingestion service}
- __pub_alert_app__: {The ID of the alert ingestion application}
- __pub_alert_protocol__: "cloud_monitor"
- __pub_alert_region__: {The region of the endpoint to which the alert is sent}
After the CloudMonitor alert is ingested into Log Service, the following fields are not added to the annotations field of the corresponding Log Service alert: name, id, eventTime, timeMetrics, content, ver, and resourceId.
The key-value pairs in the content field are expanded and the content_ prefix is added to each key-value pair, for example, "content_snapshotType": "timer".
Note If you add an annotation on the Enrichment tab when you create the alert ingestion application, the annotation is added to the annotations field.severity level The severity of the alert. For more information, see Severity levels. policy None The alert policy that is specified for the alert ingestion application. For more information, see Description of the policy variable. project None The project to which Alert Center belongs. For more information, see Project. region regionId The region to which the project belongs. drill_down_query None The value is a link. The link consists of the URL of the CloudMonitor console, the value of the product field, and the value of the name field. You can click the link to go to the Event Monitoring page of the CloudMonitor console.