Grafana provides a GUI that allows you to use the alerting feature. You can add a contact point in Grafana so that Grafana can send alerts to the alerting system of Log Service. Then, the alerting system processes the alerts, such as denoising the alerts and sending alert notifications. If your Grafana version is 8.0 or later, you can follow the instructions in this topic.
Prerequisites
Configure Grafana
- Create a contact point.
- On the Create contact point page, configure the following parameters.
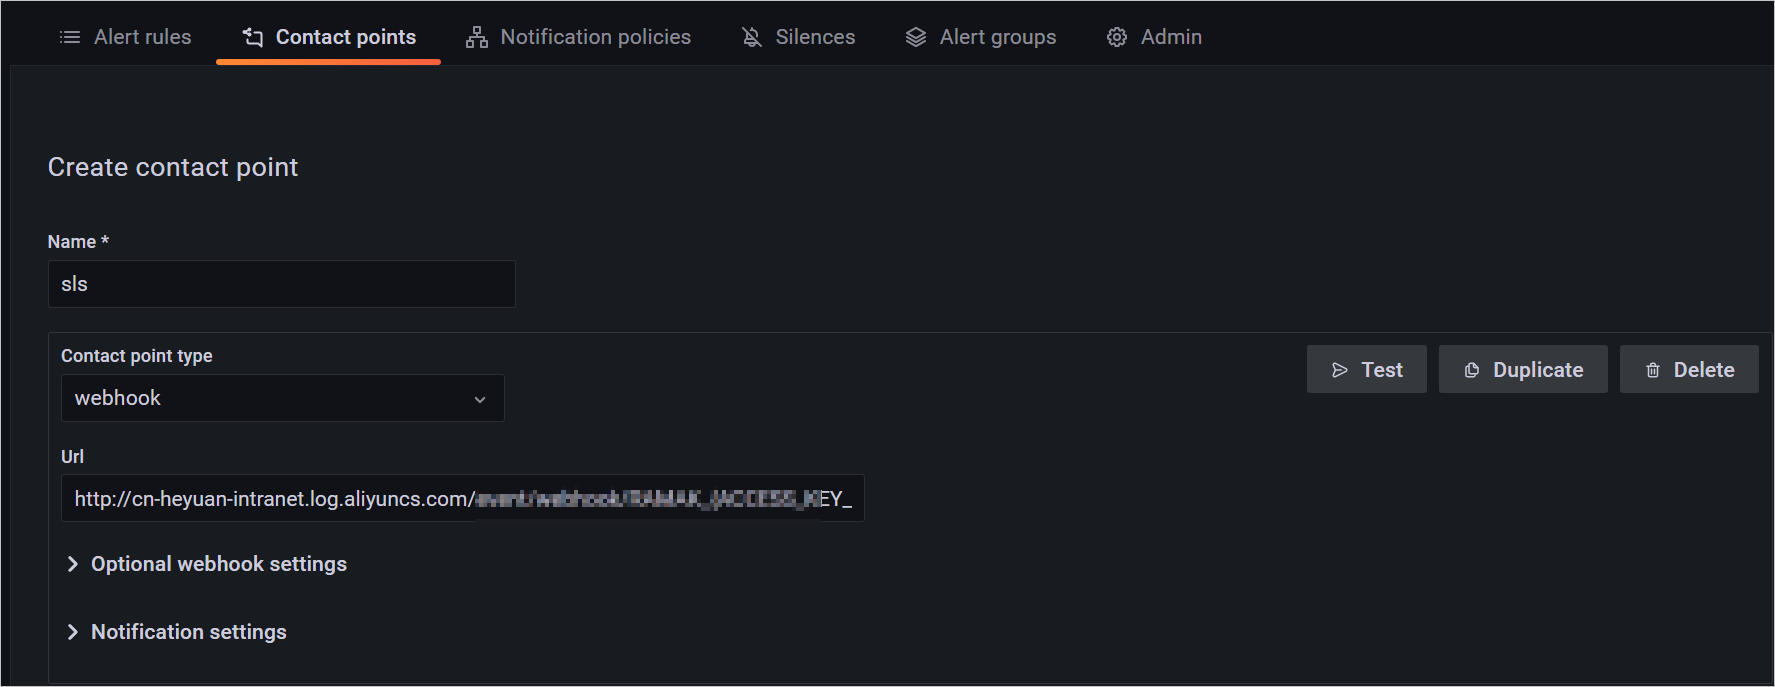
Parameter Description Name The name of the contact point. Contact point type The type of the contact point. In this example, select webhook. Url The URL of the contact point. In this example, enter the full URL of the webhook URL that is generated after you create an alert ingestion service and an alert ingestion application in the alert ingestion system of Log Service. For more information, see Obtain webhook URLs.
- On the Create contact point page, configure the following parameters.
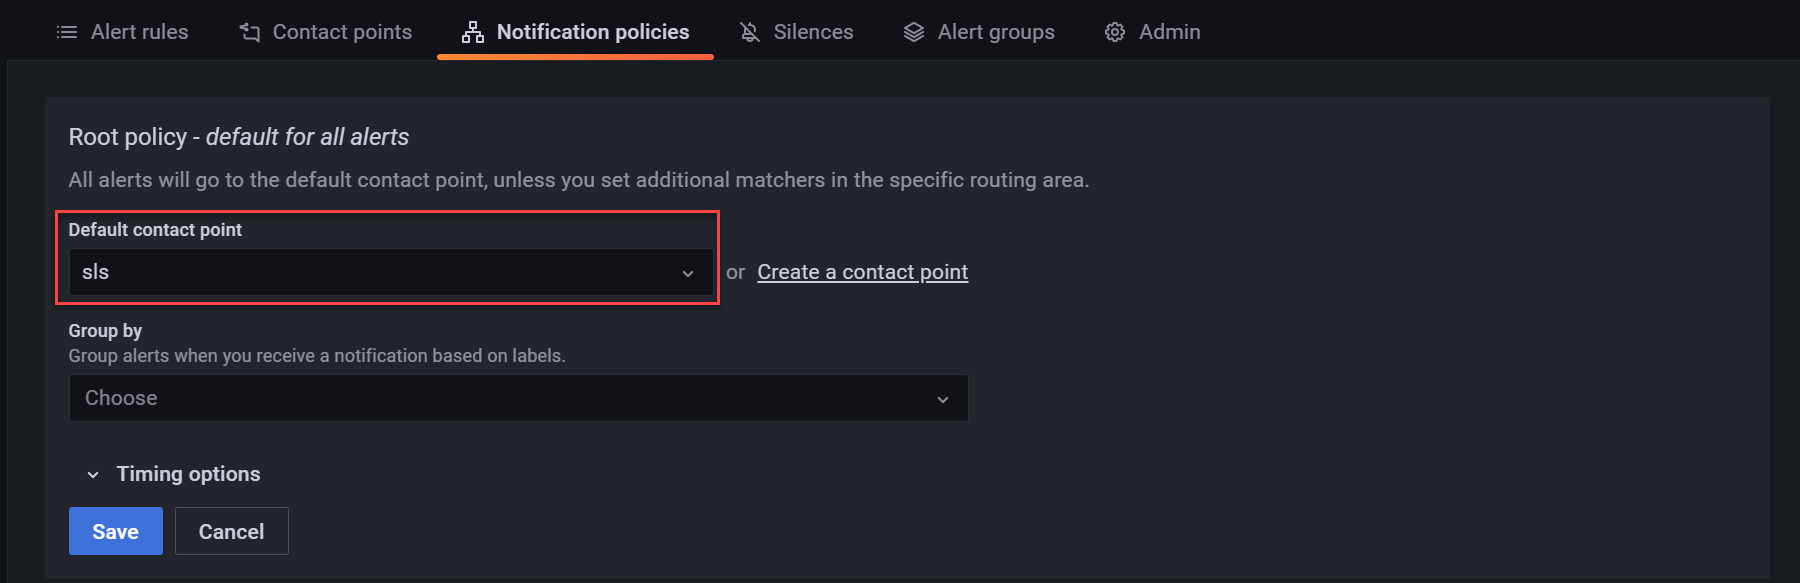
- Add the contact point to a notification policy. You can add the contact point to the root notification policy, or create a route and add the contact point to the route. In this example, add the contact point to the root notification policy.
- In the Default contact point drop-down list, select the contact point that is created in Step 2.
- In the Default contact point drop-down list, select the contact point that is created in Step 2.
Grafana alerts
The following sample code provides an example of a Grafana alert:
{
    "receiver": "http",
    "status": "firing",
    "alerts":
    [
        {
            "status": "firing",
            "labels":
            {
                "alertname": "test"
            },
            "annotations":
            {
                "description": "test alert",
            },
            "startsAt": "2022-02-17T21:44:07.106902+08:00",
            "endsAt": "0001-01-01T00:00:00Z",
            "generatorURL": "http://localhost:3000/alerting/abcd/edit",
            "fingerprint": "65d7bbdb01ce6c93",
            "silenceURL": "http://localhost:3000/alerting/silence/new?alertmanager=grafana&matchers=alertname%3Dtest",
            "dashboardURL": "",
            "panelURL": "",
            "valueString": "[ metric='go_threads{instance=\"prometheus\", job=\"prometheus\"}' labels={__name__=go_threads, instance=prometheus, job=prometheus} value=15 ]"
        }
    ],
    "groupLabels":
    {},
    "commonLabels":
    {
        "alertname": "test"
    },
    "commonAnnotations":
    {
        "description": "test alert",
    },
    "externalURL": "http://localhost:3000/",
    "version": "1",
    "groupKey": "{}/{alertname=\"test\"}:{}",
    "truncatedAlerts": 0,
    "orgId": 1,
    "title": "[FIRING:1]  (test)",
    "state": "alerting",
    "message": "**Firing**\n\nValue: [ metric='go_threads{instance=\"prometheus\", job=\"prometheus\"}' labels={__name__=go_threads, instance=prometheus, job=prometheus} value=15 ]\nLabels:\n - alertname = test\nAnnotations:\n - description = test alert\nSource: http://localhost:3000/alerting/abcd/edit\nSilence: http://localhost:3000/alerting/silence/new?alertmanager=grafana&matchers=alertname%3Dtest\n"
}
Field mappings
After a Grafana alert is ingested into Log Service, the alert is converted to a Log Service alert based on field mappings. The following sample code provides an example of a Log Service alert:
{
    "aliuid": "{The ID of the Alibaba Cloud account to which the alert ingestion application belongs}",
    "alert_instance_id": "{The alert instance ID that is automatically generated}",
    "alert_id": "test",
    "alert_type": "sls_pub",
    "alert_name": "test",
    "region": "{The region of the project to which Alert Center belongs}",
    "project": "{The project to which Alert Center belongs}",
    "project_id": 0,
    "next_eval_interval": 0,
    "alert_time": 1645607565,
    "fire_time": 1645105447,
    "fire_results": null,
    "fire_results_count": 0,
    "resolve_time": 0,
    "status": "firing",
    "results": null,
    "labels":
    {},
    "annotations":
    {
        "__config_app__": "sls_pub_alert",
        "__pub_alert_app__": "{The ID of the alert ingestion application}",
        "__pub_alert_protocol__": "grafana8",
        "__pub_alert_region__": "{The region of the endpoint to which the alert is sent}",
        "__pub_alert_service__": "{The ID of the alert ingestion service}",
        "desc": "test alert",
        "fingerprint": "65d7bbdb01ce6c93",
        "silenceURL": "http://localhost:3000/alerting/silence/new?alertmanager=grafana&matchers=alertname%3Dtest",
        "valueString": "[ metric='go_threads{instance=\"prometheus\", job=\"prometheus\"}' labels={__name__=go_threads, instance=prometheus, job=prometheus} value=15 ]"
    },
    "severity": 6,
    "policy":
    {
        "alert_policy_id": "{The alert policy that is specified for the alert ingestion application}",
        "action_policy_id": "{The action policy that is specified for the alert ingestion application}",
        "use_default": false,
        "repeat_interval": "{The repeat interval that is specified for the alert ingestion application}"
    },
    "template": null,
    "drill_down_query": "http://localhost:3000/alerting/abcd/edit",
}| Log Service field | Grafana field | Description |
|---|---|---|
| aliuid | None | The ID of the Alibaba Cloud account to which the alert ingestion application belongs. |
| alert_id | alertname | The ID of the alert monitoring rule.
If the labels field in the Grafana alert contains the alertname field, the value of the alert_id field is the same as the value of the alertname field. Otherwise, the alert_id field is empty. |
| alert_type | None | The type of the alert. The value is fixed as sls_pub. |
| alert_name | alertname | The name of the alert monitoring rule.
If the labels field in the Grafana alert contains the alertname field, the value of the alert_name field is the same as the value of the alertname field. In addition, the alertname field in the Grafana alert is deleted after conversion. If the values are different, the alert_name field is empty. |
| status | status | The status of the alert. |
| next_eval_interval | None | The interval at which the alert is evaluated. The value is fixed as 0. |
| alert_time | None | The time at which the alert is first triggered. The value of this field indicates the time at which Log Service receives the Grafana alert. |
| fire_time | startsAt | The time at which the alert is triggered. |
| resolve_time | endsAt | The time at which the alert is cleared.
If the value of the status field in the Grafana alert is firing, the value of the resolve_time field is 0. Otherwise, the value of the resolve_time field is the timestamp that is indicated by the endsAt field. |
| labels | labels | The labels of the alert.
If you add a label on the Enrichment tab when you create the alert ingestion application, the label is added to the labels field. |
| annotations | annotations | The annotations of the alert. The following fields are added to the annotations field in the Log Service alert:
If you add an annotation on the Enrichment tab when you create the alert ingestion application, the annotation is added to the annotations field. |
| severity | severity | The severity level of the alert.
Note If the annotations or labels field in a Grafana alert contains the severity field, Log Service maps the value of the severity field in the Grafana alert to a
severity in the Log Service alert after the Grafana alert is ingested into Log Service.
If the annotations or labels field in a Grafana alert does not contain the severity
field, Log Service uses the medium severity for the alert by default. For more information,
see Severity levels.
|
| policy | None | The alert policy that is specified for the alert ingestion application. For more information, see Description of the policy variable. |
| project | None | The project to which Alert Center belongs. For more information, see Project. |
| drill_down_query |
|
The URL of the Grafana alert.
If you click the URL, you are redirected to the alert management page of Grafana. On this page, Grafana automatically displays alerts that match the content of the groupLabels field. |