A treemap chart is a data visualization tool that you can use to display the relationship between parts and the whole and the comparison between parts. This topic describes how to configure a treemap chart.
Overview
A treemap chart includes multiple rectangles that represent data sizes. A larger rectangle represents a higher proportion of categorical data.
The rectangles in a treemap chart are sorted.
Configuration example
In the left-side navigation pane, click Log Storage. In the Logstores list, click the logstore you want.
In the left-side navigation pane, choose Dashboard > Dashboards. In the dashboard list, click the dashboard you want. In the upper-right corner of the dashboard page, click Edit. In edit mode, click Add > Add Chart.
On the right side of the Edit Chart page, select Treemap Chart Pro in the Chart Types section and configure the Title parameter in the Basic Configurations section. On the left side of the Edit Chart page, configure the query time range, Logstore, and query statement for the chart. After you complete the configuration, click Apply in the upper part of the Edit Chart page to view the configuration effects of the treemap chart.
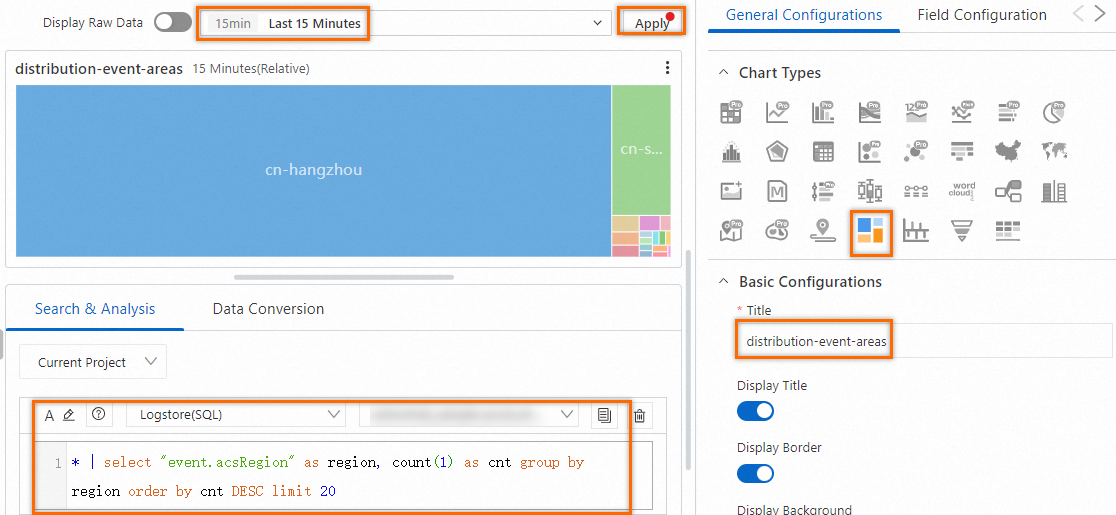
The following query statement is used to query the distribution of events by region:
* | select "event.acsRegion" as region, count(1) as cnt group by region order by cnt DESC limit 20 Configuration on the General Configurations tab
You can configure global settings for a treemap chart on the General Configurations tab.
Basic Configurations
Parameter
Description
Title
The title of the chart.
Display Title
If you turn on Display Title, the title of the chart is displayed.
Display Border
If you turn on Display Border, the borders of the chart are displayed.
Display Background
If you turn on Display Background, the background color of the chart is displayed.
Display Time
If you turn on Display Time, the query time range of the chart is displayed.
Fixed Time
If you turn on Fixed Time, the query time range of the chart is independent of the global time range of the dashboard.
Standard Configurations
Parameter
Description
Format
The display format of numeric values.
Unit
The unit of numeric values.
Number of Digits after Decimal Point
The decimal places of numeric values.
Display Name
The name of the display field.
If you specify a value for Display Name, the value is used as the names for all display fields in the chart. If you want to change the name of a display field, you must configure parameters on the Field Configuration tab.
Color Scheme
The color scheme of the chart.
Built-in: uses the built-in color scheme.
Solid: uses the color that you select.
Threshold: uses different colors for different values based on the specified thresholds for the values.
Parameters in the Query and Analysis Configurations section
Parameter
Description
Category
The categorical field.
Value Column
The field that contains the required numeric values. The larger the value, the larger the rectangle.
Parameters in the Threshold section
Parameter
Description
Threshold
The thresholds of numeric values.
If you set the Color Scheme parameter to Threshold and specify thresholds in the Threshold section, the background of the treemap chart is displayed in different colors based on the specified thresholds.
Parameters in the Variable Replacement section
Parameter
Description
Variable Replacement
The settings for variable replacement. You can click AddVariable Replacement to add a filter of the Variable Replacement type to the treemap chart. After you configure the settings for variable replacement on the General Configurations tab, Simple Log Service adds a filter in the upper-left corner of the treemap chart. You can select a value from the filter drop-down list. After you select a value, Simple Log Service automatically replaces the variable in the query statement of the treemap chart with the variable value indicated by the value that you select, and performs a query and analysis operation. For more information, see Example 2: Configure variable replacement.
Parameters in the Documentation section
Parameter
Description
Add Documentation Link
The button that allows you to specify custom document links and descriptions. After you configure the settings, the specified information is displayed in the upper right corner of the treemap chart.
Configuration on the Field Configuration tab
You can configure personalized display settings for the results of a single query statement or for a single column of data in the results. For more information, see Configuration on the General Configurations tab.
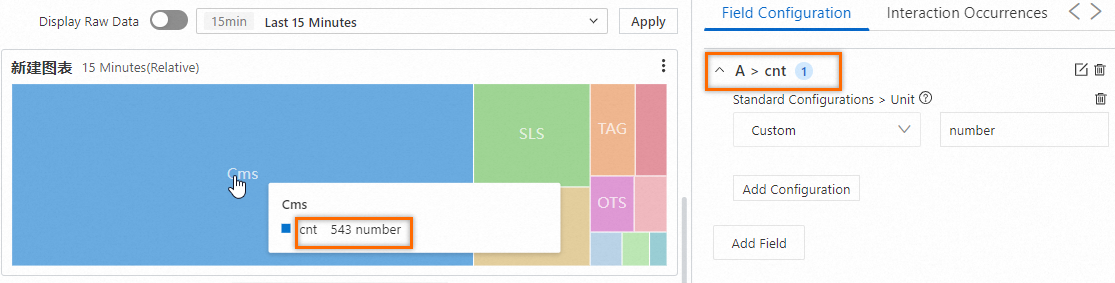
For example, you can select A > cnt to configure settings for the cnt field in the query results of Query Statement A. In the following figure, the unit of the cnt field is set to number.
Configuration on the Interaction Occurrences tab
You can configure an interaction occurrence for the results of a single query statement or for a single column of data in the results to analyze data in a finer-grained manner. Supported types of interaction occurrences include Open Logstore, Open Saved Search, Open Dashboard, Open Trace Analysis, Open Trace Details, and Create Custom HTTP URL. For more information, see Interaction occurrences.
For example, in the A section, you can configure an Open Logstore interaction occurrence for the results of Query Statement A. After you configure the interaction occurrence, you can click a point in the treemap chart and click Open Logstore. Then, you are navigated to the Logstore that you specify.