This topic describes how to use a Jaeger client to connect Simple Log Service to Jaeger.
Background information
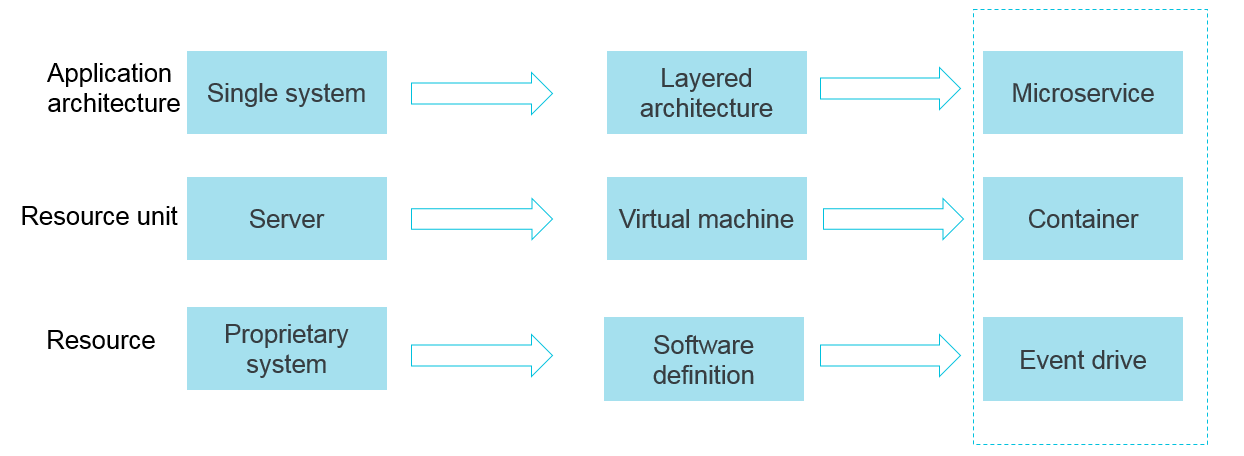
Containers and serverless programming methods help improve the efficiency in software delivery and deployment. The following section describes the changes in an application architecture.
The application architecture changes from single system-based to microservice-based. The business logic changes to calls and requests between microservices.
In terms of resources, traditional servers gradually change to virtual resources.
The preceding changes in the elastic and standard architecture pose more challenges to O&M and diagnostics. To address the challenges, Alibaba Cloud developed various development and operations (DevOps)-oriented diagnostic and analysis systems, including centralized logging systems, centralized metrics systems, and distributed tracing systems.
Alibaba Cloud also provides XTrace, which is used to trace OpenTracing links. XTrace functions similarly to Jaeger. For more information, see XTrace.
Features of logging, metrics, and tracing systems
A logging system records discrete events.
For example, a logging system records the debugging or error information of applications. You can use the information to troubleshoot issues.
A metrics system records aggregatable data.
For example, you can define the depth of a queue as a metric and update the metric when an element is added to or removed from the queue. You can also create a counter to count the number of HTTP requests.
A tracing system records request-scoped information.
For example, a tracing system records the execution process and duration of a remote procedure call (RPC). A tracing system also allows you to troubleshoot the performance issues of a system in an efficient manner.
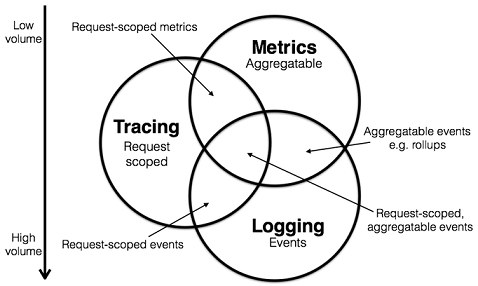
The preceding figure is from the website of Peter Bourgon.
You can classify existing systems based on the preceding descriptions. For example, you can classify Zipkin systems into the tracing category. You can classify Prometheus systems into the metrics category. Prometheus focuses on metrics systems at first and may integrate with more tracing features in the future. However, Prometheus is unlikely to integrate with logging features. You can classify Elasticsearch, Logstash, and Kibana (ELK) and Alibaba Cloud Simple Log Service systems into the logging category. ELK and Simple Log Service systems continuously integrate with the features of other systems and are moving toward the intersection of all systems, as shown in the preceding figure.
For more information, visit the website of Peter Bourgon. The following sections describe the tracing systems.
Tracing
The following tracing systems are widely used:
Dapper (Google): basis of all tracers
Stackdriver Trace (Google)
Zipkin (Twitter)
AppDash (Go)
EagleEye (Taobao)
Ditecting (Apsara Distributed File System and Alibaba Cloud services)
Yuntu (Ant Group)
strace (Shenma)
X-Ray (AWS)
Distributed tracing systems rapidly developed into many variants. In most cases, a distributed tracing system works based on the following core steps:
Code tracking
Data storage
Query display
The following figure shows the lifecycle of a distributed call. When a client initiates a request, the request is first sent to the load balancer. Then, the request is processed by the authentication and billing services. The resources that are requested are allocated and provisioned. At the end of the lifecycle, the system returns a result for the request. 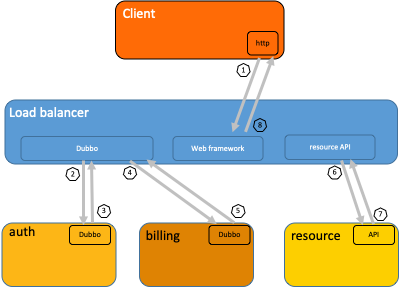 In most cases, after a distributed tracing system collects and stores data, the system uses a time series chart that contains a timeline to display the trace. However, during data collection, the business logic of collection logs and user code are deeply integrated, and the APIs of different systems are incompatible. This can cause issues when you switch between tracing systems.
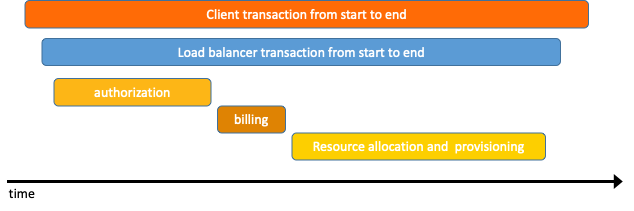
OpenTracing
To prevent API compatibility issues among different distributed tracing systems, the OpenTracing specification is developed. OpenTracing is a lightweight standardization layer. This layer is located between applications or class libraries and tracing or log analysis programs. For more information, see OpenTracing.
Benefits:
OpenTracing is a member of the Cloud Native Computing Foundation (CNCF) and provides standard concepts and data standards for global distributed tracing systems.
OpenTracing provides platform-neutral and vendor-neutral APIs. This allows developers to add or switch between tracing systems in an efficient manner.
Data model:
In OpenTracing, a span is the primary building block of a trace. A trace is considered as a directed acyclic graph (DAG) that consists of multiple spans. The relationships between spans are called references. The following example shows a trace that consists of eight spans:
Causal relationships between spans in a single trace
        [Span A]  ←←←(the root span)
            |
     +------+------+
     |             |
 [Span B]      [Span C] ←←←(ChildOf: Span C is a child node of Span A.)
     |             |
 [Span D]      +---+-------+
               |           |
           [Span E]    [Span F] >>> [Span G] >>> [Span H]
                                       ↑
                                       ↑
                                       ↑
                         (FollowsFrom: Span G is invoked after Span F is invoked.)
A timeline-based time series chart can display a trace in a more intuitive manner. Example:
Time relationships between spans in a single trace
––|–––––––|–––––––|–––––––|–––––––|–––––––|–––––––|–––––––|–> time
 [Span A···················································]
   [Span B··············································]
      [Span D··········································]
    [Span C········································]
         [Span E·······]        [Span F··] [Span G··] [Span H··]
Each span includes the following objects:
An operation name.
The start timestamp of the operation.
The end timestamp of the operation.
A set of span tags. Span tags are key-value pairs. In a key-value pair, the key must be a string and the value can be a string, Boolean, or numeric value.
A set of span logs. A log contains a key-value pair and a timestamp. In a key-value pair, the key must be a string and the value can be of an arbitrary data type. However, some OpenTracing tracers may not support all data types.
The context of the span, which is specified by SpanContext. Each context contains the following information:
The current trace status, which can be a trace ID or a span ID. An OpenTracing tracer must transmit the current trace status across process boundaries based on a specified span.
Baggage items, which are key-value pairs, are included in a trace. The key-value pairs must be transmitted across process boundaries.
References, which indicate the relationships between zero or multiple related spans. Relationships are established between spans based on a context that is specified by SpanContext.
For more information about the OpenTracing data model, see OpenTracing data model.
For more information about all OpenTracing implementations, see OpenTracing. Jaeger and Zipkin are widely used. For more information, see Jaeger and Zipkin.
Jaeger
Jaeger is an open source distributed tracing system that is provided by Uber. Jaeger is compatible with OpenTracing APIs. 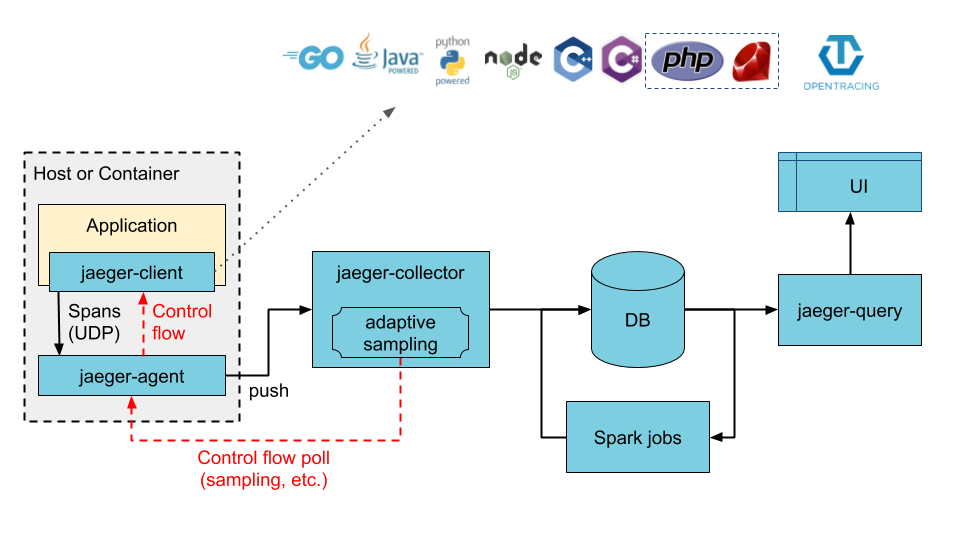
The preceding figure is from the JAEGER official website.
Jaeger contains the following components:
jaeger-client: implements language-specific SDKs that conform to the OpenTracing specification. When an application calls an API operation to write data, the client library sends trace information to the jaeger-agent component based on the sampling policy that is specified in the application.
jaeger-agent: works as a network daemon that monitors UDP ports. The jaeger-agent component receives span data and sends the span data to the jaeger-collector component in batches. jaeger-agent is a basic component that is deployed on all hosts. jaeger-agent decouples the client library from the jaeger-collector component. In this case, the client library cannot route data or discover the jaeger-collector component.
jaeger-collector: receives data from the jaeger-agent component and writes the data to a data store. jaeger-collector is a stateless component. You can run an arbitrary number of jaeger-collector components.
Data store: works as a pluggable component that allows you to write data to Apache Cassandra and Elasticsearch.
jaeger-query: receives query requests, retrieves trace information from a data store, and then displays the result in the user interface (UI). jaeger-query is a stateless component. You can start multiple instances of the jaeger-query component and deploy the instances behind NGINX load balancers.
Jaeger on Alibaba Cloud Simple Log Service
Jaeger on Alibaba Cloud Simple Log Service is a Jaeger-based distributed tracing system that stores tracing data to Simple Log Service for persistent storage. The tracing data can be queried and displayed by using Jaeger API. For more information, see Jaeger on Alibaba Cloud Simple Log Service. 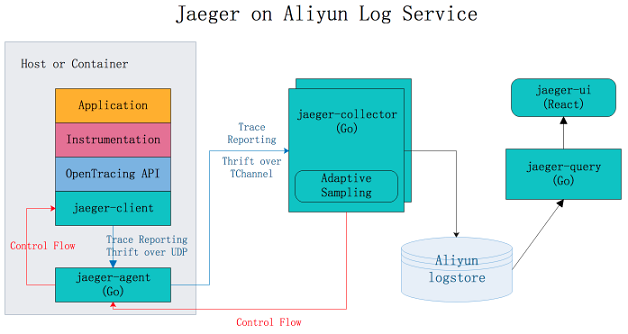
Benefits:
Jaeger allows you to store data to Apache Cassandra and Elasticsearch for persistent storage. You must maintain the stability of data stores and adjust the storage capacity. Jaeger on Alibaba Cloud Simple Log Service utilizes the capability of Simple Log Service to process large amounts of data. This way, you can use the Jaeger distributed tracing technology without the need to focus on data stores.
The Jaeger UI can be used to query and display traces, but provides insufficient support for analysis and troubleshooting. Jaeger on Alibaba Cloud Simple Log Service allows you to use the query and analysis features of Simple Log Service to analyze system issues in an efficient manner.
For more information about how to configure Jaeger on Alibaba Cloud Simple Log Service, see GitHub.