Prometheus is a cloud native application that you can use to collect and monitor metric data of various software and systems. This topic describes how to collect metric data from Prometheus to Simple Log Service (SLS). This topic also describes how to use SLS to analyze and monitor the data.
Prerequisites
A metricstore is created. For more information, see Create a metricstore.
Prometheus is installed. For more information, see GETTING STARTED.
Data collection rules are configured in Prometheus. For more information, see scrape_config.
Procedure
SLS supports the Remote Write Protocol. Use the remote write feature of Prometheus to collect metric data to SLS. Before using the remote write feature, you must perform the following steps in Prometheus:
Log on to the server on which Prometheus is installed.
Open the configuration file and configure the parameters based on your business requirements. For more information, see remote_write.
url: https://sls-prometheus-test.cn-beijing.log.aliyuncs.com/prometheus/sls-prometheus-test/prometheus-raw/api/v1/write
basic_auth:
  username: access-key-id
  password: access-key-secret

queue_config:
  batch_send_deadline: 20s
  capacity: 20480
  max_backoff: 5s
  max_samples_per_send: 2048
  min_backoff: 100ms
  min_shards: 100
Parameter
Description
url
The URL of a metricstore in SLS. Format: https://{project}.{sls-endpoint}/prometheus/{project}/{metricstore}/api/v1/write. Take note of the following instructions:
{sls-endpoint}: the SLS endpoint. For more information, see Endpoints.
{project}: the project that you created.
{metricstore}: the metricstore that you created.
ImportantIf you use an Alibaba Cloud internal network, we recommend that you use an internal SLS endpoint.
To ensure secure transmission, we recommend that you use HTTPS.
basic_auth
The authentication information. If data is written to SLS over the Remote Write Protocol, basic authentication is required. Take note of the following instructions:
username: the AccessKey ID of your Alibaba Cloud account.
password: the AccessKey secret of your Alibaba Cloud account.
We recommend that you use the AccessKey pair of a RAM user that has only the write permissions on the SLS project. For more information, see Use custom policies to grant permissions to a RAM user.
queue_config
The policies used to write data, such as cache and retry policies.
To minimize invalid network requests, set min_backoff to a value that is greater than or equal to 100ms and set max_backoff to a value that is greater than or equal to 5s.
If you want to collect a large amount of metric data from Prometheus, use the following settings for queue_config:
batch_send_deadline: 20s
capacity: 20480
max_backoff: 5s
max_samples_per_send: 2048
min_backoff: 100ms
min_shards: 100
Check whether data is collected to SLS.
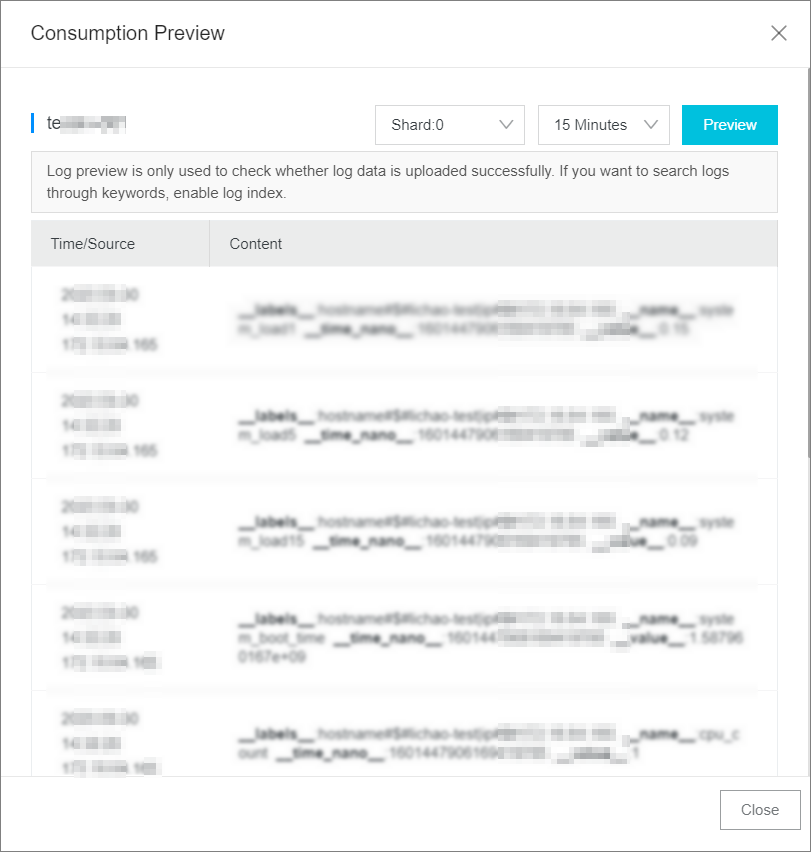
After you configure Prometheus, use the preview feature in the SLS console to check whether data is collected to SLS.
Log on to the Simple Log Service console.
In the Projects section, click the name of the project.
On the tab, choose
 > Consumption Preview next to the name of the metricstore.
 If data is displayed in the Consumption Preview panel, Prometheus is correctly configured.
 Important
If metric data is written to an SLS metricstore using the remote write protocol, SLS uses
MetricNameandLabelsas the default HashKey to route metric data from different timelines to specific shards and improve data locality.
What to do next
After metric data is collected from Prometheus, perform the following operations on the data:
Query and analyze Prometheus metric data on SLS. For more information, see Query and analyze metric data.
Visualize Prometheus metric data on Grafana. For more information, see Send time series data from Simple Log Service to Grafana.