This topic describes how to use Lindorm machine learning (ML) to perform time series forecasting.
Background information
Accurate time series forecasting is the core capability that is required in various businesses such as e-commerce, logistics, transportation, and tourism. Time series forecasting is performed in different scenarios to obtain different results at the required time granularity. Time series forecasting can provide forecasting results at a time granularity that best suits the scenario, such as days, hours, or a finer granularity. In addition, time series forecasting is necessary in a variety of decision-making scenarios. For example, you can forecast the sales of a product on an online shopping platform, and then make decisions based on the forecasting results for the subsequent procedures of the product, such as ordering, agreement fulfillment, warehousing, inventory, replenishment, and allocation.
Prerequisites
- Lindorm ML is enabled for LindormTSDB. For more information about how to enable Lindorm ML, see Enable Lindorm ML.
- The version of LindormTSDB is 3.4.21 or later. For more information about how to view or upgrade the version of LindormTSDB, see Release notes of LindormTSDB and Upgrade the minor engine version of a Lindorm instance.
- You are connected to LindormTSDB by using lindorm-cli. A table is created in your database, and data is imported to the table. For more information, see Use Lindorm-cli to connect to and use LindormTSDB.
Data preparation
In this topic, a table named fresh_sales is used as an example. The fresh_sales table contains only one time series with the following tags: id_code=bf502edc7025604a51c96d21e09de0e8, brand_id=11077664934, cate1_id=104, and cate2_id=237. The fresh_sales table contains only one field column named sales.
The following example shows the schema of the fresh_sales table:
+------------+-----------+------------+------------+
| columnName | typeName  | columnKind | primaryKey |
+------------+-----------+------------+------------+
| id_code    | VARCHAR   | TAG        | true       |
| time       | TIMESTAMP | TIMESTAMP  | false      |
| sales      | DOUBLE    | FIELD      | false      |
| brand_id   | VARCHAR   | TAG        | false      |
| cate1_id   | VARCHAR   | TAG        | false      |
| cate2_id   | VARCHAR   | TAG        | false      |
+------------+-----------+------------+------------++---------------------------+----------------------------------+-------------+----------+----------+-------+
| time | id_code | brand_id | cate1_id | cate2_id | sales |
+---------------------------+----------------------------------+-------------+----------+----------+-------+
| 2021-01-01T00:00:00+08:00 | bf502edc7025604a51c96d21e09de0e8 | 11114152323 | 104 | 237 | 117 |
| 2021-01-02T00:00:00+08:00 | bf502edc7025604a51c96d21e09de0e8 | 11114152323 | 104 | 237 | 118 |
| 2021-01-03T00:00:00+08:00 | bf502edc7025604a51c96d21e09de0e8 | 11114152323 | 104 | 237 | 144 |
| 2021-01-04T00:00:00+08:00 | bf502edc7025604a51c96d21e09de0e8 | 11114152323 | 104 | 237 | 133 |
| 2021-01-05T00:00:00+08:00 | bf502edc7025604a51c96d21e09de0e8 | 11114152323 | 104 | 237 | 126 |
+---------------------------+----------------------------------+-------------+----------+----------+-------+Time series forecasting
This section describes how to use Lindorm ML to forecast the sales of a product based on the prepared data.
- Use the CREATE MODEL statement to train the model. The following statements provide an example on how to train the model:
CREATE MODEL tft_model
FROM (SELECT * FROM fresh_sales WHERE `time` > '2021-02-08T00:00:00+08:00')
TARGET sales
TASK time_series_forecast
ALGORITHM tft
SETTINGS
(
  time_column 'time',
  group_columns 'id_code',
  feat_static_columns 'cate1_id,cate2_id,brand_id',
  context_length '28',
  prediction_length '6',
  epochs '5',
  freq '1D'
);
Note If you set TASK to TIME_SERIES_FORECAST, you can use only the forecast function in model inference. - Manage the model. You can use the
SHOW MODEL model_namestatement to view the information about the model. The following statement provides an example on how to view the information about the model:SHOW MODEL tft_model;The following information is returned:
+-----------+--------+--------------+----------------------+-----------+------------------------------------+---------------+-------------------------------------------------+--------------------------------+-------------------------------+-------------------------------+ | name | status | sql_function | problem_type | algorithm | query | preprocessors | settings | metrics | created_time | update_time | +-----------+--------+--------------+----------------------+-----------+------------------------------------+---------------+-------------------------------------------------+--------------------------------+-------------------------------+-------------------------------+ | tft_model | Ready | forecast | TIME_SERIES_FORECAST | TFT | SELECT `time`, FIRST(`sales`) AS | [] | {time_column=time, group_columns=id_code, | {MAPE=0.35002756118774414, | 2022-11-04T11:38:05.873+08:00 | 2022-11-04T11:39:14.046+08:00 | | | | | | | `sales`, `id_code`, `cate1_id`, | | feat_static_columns=cate1_id,cate2_id,brand_id, | MASE=0.41281554008773325, | | | | | | | | | `cate2_id`, `brand_id` FROM | | context_length=28, prediction_length=6, | MSE=456.3769938151042} | | | | | | | | | `fresh_sales` WHERE `time` > | | epochs=5, freq=1D,train_mode=LOCAL, | | | | | | | | | | '2021-02-08T00:00:00+08:00' | | past_length=28, | | | | | | | | | | sample by 1D fill zero | | forecast_start=2022-07-31 08:00:00} | | | | +-----------+--------+--------------+----------------------+-----------+------------------------------------+---------------+-------------------------------------------------+--------------------------------+-------------------------------+-------------------------------+ - Perform inference based on the trained model. Use the forecast function to forecast the result. The following statement provides an example on how to perform time series forecasting:
SELECT `time`, id_code, forecast(sales, 'tft_model') AS sales_forecast FROM fresh_sales WHERE `time` >= '2022-07-18T00:00:00+08:00' AND id_code = 'bf502edc7025604a51c96d21e09de0e8' sample BY 0;The following information is returned:
+---------------------------+----------------------------------+--------------------+
|           time            |             id_code              |   sales_forecast   |
+---------------------------+----------------------------------+--------------------+
| 2022-07-18T00:00:00+08:00 | bf502edc7025604a51c96d21e09de0e8 | 57.61831283569336  |
| 2022-07-19T00:00:00+08:00 | bf502edc7025604a51c96d21e09de0e8 | 57.64776611328125  |
| 2022-07-20T00:00:00+08:00 | bf502edc7025604a51c96d21e09de0e8 | 58.00449752807617  |
| 2022-07-21T00:00:00+08:00 | bf502edc7025604a51c96d21e09de0e8 | 59.41561508178711  |
| 2022-07-22T00:00:00+08:00 | bf502edc7025604a51c96d21e09de0e8 | 58.925498962402344 |
| 2022-07-23T00:00:00+08:00 | bf502edc7025604a51c96d21e09de0e8 | 58.494712829589844 |
+---------------------------+----------------------------------+--------------------+
Calculate the accuracy of time series forecasting
In this topic, the forecasting of the sales of a product is used as an example to describe how to calculate the accuracy of the time series forecasting results.
In scenarios where you need to forecast the sales of a product, you must forecast results for data in multiple time series at the same time. Therefore, the accuracy of the time series forecasting algorithm can be measured by using the following formula: 1 - Weighted Mean Absolute Percentage Error (WMAPE). In this example, the real sales of the product i within t days is Rit, and the forecast sales of the product is Fit.
- You can calculate the daily accuracy of the forecast sales by using the following formula:
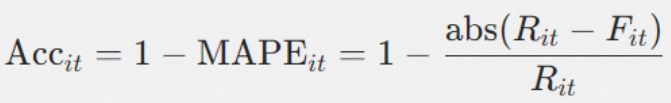
In the preceding formula, the abs function is used to calculate the absolute value of the input value.
For example, if the real sales of the product on a certain day (Rit) is 63, and the forecast sales of the product on the same day (Fit) is 58, the accuracy of time series forecasting on the day is rounded up to 92.1% based on the preceding formula.
- Calculate the overall accuracy of time series forecasting by summarizing the average accuracy weighted by the real sales of the product (Rit), as shown in the following formula:
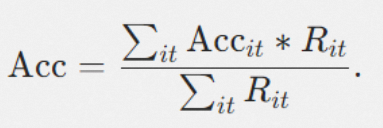
In the preceding formula, ∑ is the sum function used to calculate the sum of all results.
For example, if the accuracy rates of time series forecasting on three days are 92.1%, 92.6%, and 100%, the real sales volumes on the three days (Rit) are 63, 54, and 58, and the forecast sales volumes on the three days (Fit) are 58, 58, and 58, the overall accuracy of time series forecasting over the three days can be rounded up to 94.9% based on the preceding formula.