Managed Service for Grafana includes a built-in CloudMonitor data source plug-in called CMS Grafana Service. Connect this plug-in to stream CloudMonitor metrics directly into Grafana dashboards in real time -- no data export or migration required.
This guide walks you through adding the CloudMonitor data source to a Grafana workspace and creating dashboard panels to visualize monitoring metrics.
The CloudMonitor plug-in only displays metrics in Grafana dashboards. You must manually configure alert rules and dashboard layouts. For out-of-the-box dashboards and alert rules, use Managed Service for Prometheus instead.
Prerequisites
Before you begin, make sure you have:
A Managed Service for Grafana workspace with an accessible URL
Your Alibaba Cloud account ID (hover over the avatar in the upper-right corner of the Alibaba Cloud Management Console to find this value)
An AccessKey pair (AccessKey ID and AccessKey secret) for your Alibaba Cloud account or a RAM user -- see Obtain an AccessKey pair
If you use a RAM user, the RAM user must belong to your Alibaba Cloud account and have read permissions on CloudMonitor.
Step 1: Log on to Grafana
Log on to the Managed Service for Grafana console. In the left-side navigation pane, click Workspace Management.
On the Workspace Management page, find the target workspace and click the URL in the URL column to open Grafana.
You can log on with the Grafana administrator account and the password you configured when creating the workspace, or click Sign in with Alibaba Cloud to use your current Alibaba Cloud account.
Step 2: Add the CloudMonitor data source
The navigation path differs slightly between Grafana versions. The configuration parameters are the same for both.
Grafana 9.x: In the left-side navigation pane, choose  > Add data source.
Grafana 10.x: On the Grafana homepage, click the  icon. In the left-side navigation pane, choose Management > Data sources, and then click + Add data source.
After you navigate to the Add data source page, complete the following steps:
In the search box, enter CMS Grafana Service and click the result that appears.
On the Settings tab, configure the following parameters.
Parameter Description Name Data source display name. Default: CMS Grafana Service. Aliyun UserId Your Alibaba Cloud account ID. Hover over the avatar in the upper-right corner of the Alibaba Cloud Management Console to find this value. AccessKeyId The AccessKey ID of your Alibaba Cloud account or RAM user. AccessKey The AccessKey secret of your Alibaba Cloud account or RAM user. Click Save & test. If the message
Data source is workingappears, the data source is ready to use.
Step 3: Create a dashboard panel
After you add the data source, create a dashboard panel to visualize CloudMonitor metrics.
Grafana 9.x: In the left-side navigation pane, choose  > New dashboard, and then click Add a new panel.
Grafana 10.x: On the Grafana homepage, click the icon. In the left-side navigation pane, click Dashboards. Select New dashboard from the New drop-down list, and then click + Add visualization. On the Select data source page, select CMS Grafana Service.
After the panel editor opens, complete the following steps:
Grafana 9.x only: On the Query tab, select CMS Grafana Service from the Data source drop-down list.
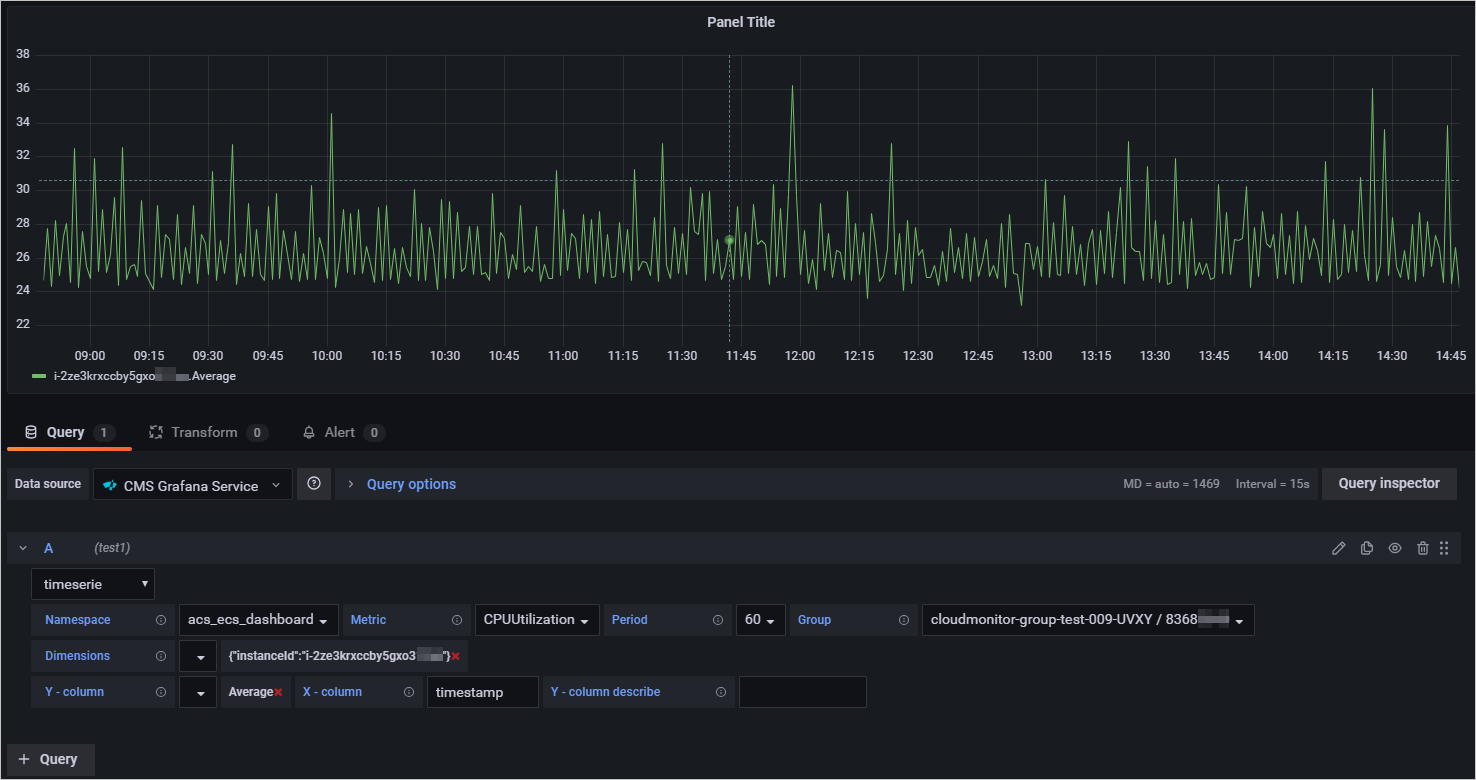
In the A section, configure the query parameters.
Parameter Description Namespace The namespace to which monitoring data is reported. Enter a name in the acs_service nameformat. For more information about the namespaces for different cloud services, see Appendix 1: Metrics.Metric The name of the monitoring metric whose data is reported. For more information about the monitoring metrics for different cloud services, see Appendix 1: Metrics. Period The aggregation interval in seconds. For more information about the time intervals for different cloud services, see Appendix 1: Metrics. Group The application group name and ID associated with the metric. Find this on the Application Groups page in the CloudMonitor console. See Application groups. Dimensions Key-value pairs that filter metrics to specific resources. You can specify multiple dimensions at a time. Example: instanceId:i-2ze2d6j5uhg20x47****. For more information, see Appendix 1: Metrics.Y-column The aggregation method for the metric values: Average, Maximum, Minimum, or Sum. For more information, see Appendix 1: Metrics. Grafana 9.x:
Grafana 10.x:
In the right-side pane, set the panel title, visualization type, and graph styles.
Click Apply.
In the upper-right corner, click the
 icon. Enter a dashboard name, select a folder, and click Save.
Step 4: View monitoring data
To view saved dashboards:
Grafana 9.x: In the left-side navigation pane, choose > Browse. Find the folder and click the dashboard name.
Grafana 10.x: On the Grafana homepage, click the icon. In the left-side navigation pane, click Dashboards. Find the folder and click the dashboard name.