You can use Simple Log Service to collect and analyze function invocation logs in real time. By importing invocation data into a Logstore, you can query, analyze, and visualize key metrics to monitor the health of your functions.
The log dashboard features described in this topic apply only to the legacy console. The configuration options for log dashboards have been removed from the current version of the Function Compute console.
We apologize for any inconvenience caused.
Prerequisites
Before you begin, make sure you have completed the following operations:
Collect and import logs
- Log on to the Function Compute console.
- In the top navigation bar, select the region where your Kubernetes cluster is deployed.
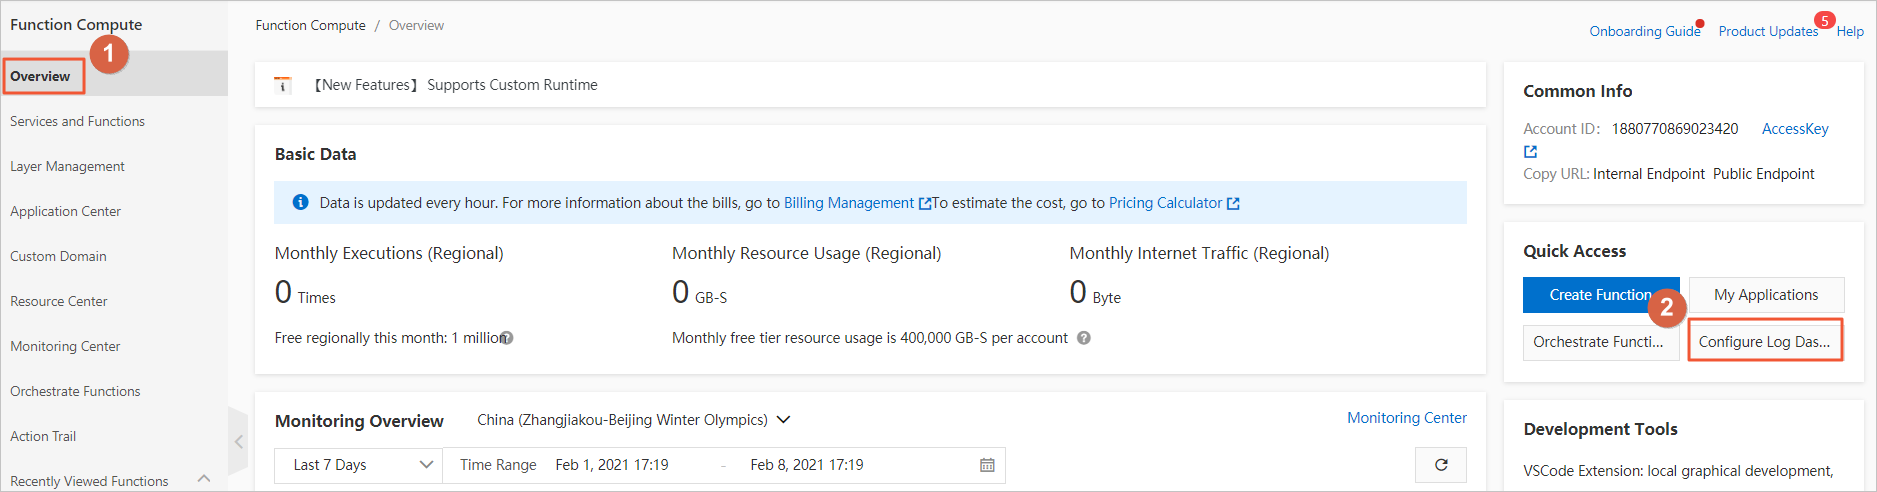
In the left-side navigation pane, click Overview.
On the Overview page, in the Quick Access section in the lower-right corner, click Configure log dashboard.
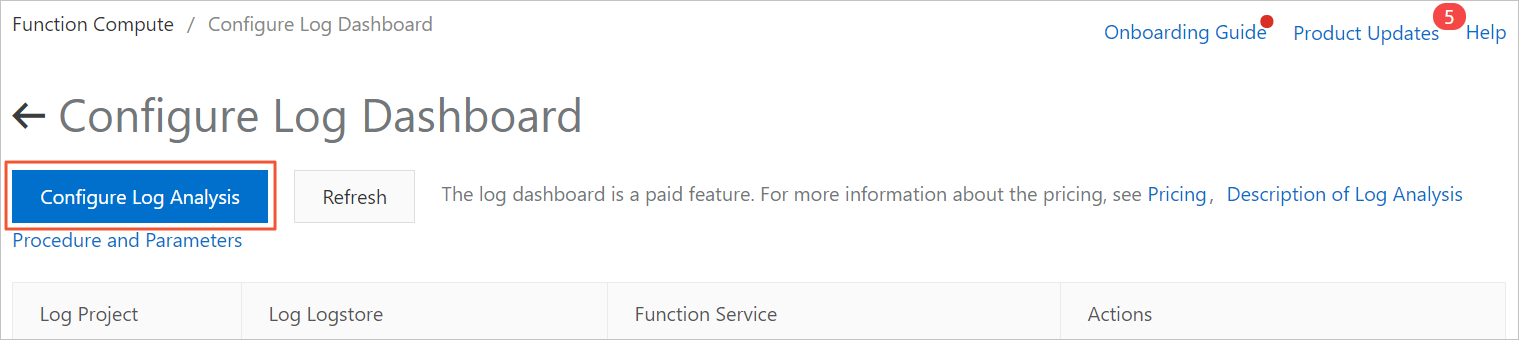
On the Configure log dashboard page, click Configure Log Analysis.
In the Custom Log Analysis panel, perform the following steps:
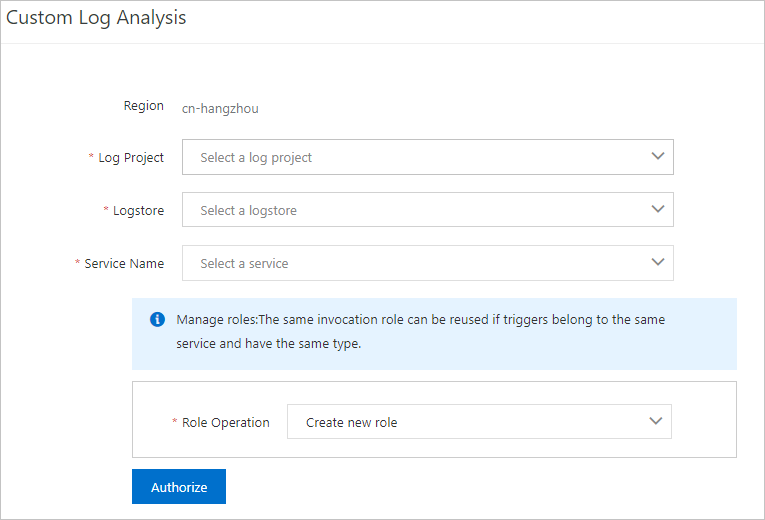
From the Log Project and Logstore drop-down lists, select an existing Log Project and Logstore in the current region.
Select the services to associate with the Logstore.
From the Role Operation drop-down list, select Create new role, and then click Authorize.
On the Role Templates page, verify the information and click Confirm Authorization Policy.
In the Custom Log Analysis panel, click OK.
Query and analyze logs
On the Configure log dashboard page in the Function Compute console, find the logs you want to query and click the associated Logstore.
On the associated Logstore page, enter a query in the search box to analyze logs. The following examples are provided:
Get detailed information about an invocation by using its requestID.
requestID:e9870cbd-2ab2-6c78-3486-cd164015b889Query for asynchronous invocation requests.
mode:async and operation:InvokeFunctionQuery for requests with an invocation duration longer than 5,000 milliseconds.
operation:InvokeFunction and durationMs > 5000
The following table describes the log fields.
Field
Type
Description
Example
accountID
String
The ID of your Alibaba Cloud account.
188********23420
asyncInvocationFinished
String
Indicates whether the asynchronous invocation is complete.
true
concurrentCount
Long
The actual concurrency of the function when the log was generated.
10
concurrentReqLimit
Long
The concurrency limit for the function.
100
durationMs
Double
The execution duration of the function, in milliseconds.
5012.025
errorType
String
The error type, if any.
HandledError
externalServiceVersion
String
The version of the service that was invoked. For more information, see Manage versions.
1
fcStatus
Long
The internal status code from Function Compute.
200
forwardedFor
String
The original IP address of the client. If you use a CDN trigger, this field indicates the IP address that invokes Function Compute.
200.***.***.100
functionErrors
Long
The number of function errors that are not system errors.
0
functionName
String
The name of the function.
ReservedFunction
functionTimeoutInSec
Long
The timeout period for the function, in seconds.
300
host
String
The host of the request.
1234567890.cn-shanghai.fc.aliyun-inc.com
isDarkLaunch
String
Indicates whether an alias or canary version was used. For more information, see the following topics:
true
ip
String
The IP address of the client that sent the request.
172.***.***.118
isHTTPS
String
Indicates whether the request used the HTTPS protocol.
false
isHTTPTrigger
String
Indicates whether the function was invoked by an HTTP trigger.
false
latency
Double
The invocation latency of the function, in milliseconds.
5017.347
maxMemoryUsage
Double
The maximum memory used by the function instance, in MB.
17.25
memoryLimitInMB
Long
The memory limit for the function instance, in MB.
512
meteredRespSize
Long
The billable traffic size, in bytes.
0
method
String
The HTTP request method.
POST
mode
String
The invocation mode. Valid values:
sync: synchronous invocation
async: asynchronous invocation
sync
operation
String
The log category.
InvokeFunction
path
String
The URL path of the function invocation.
/2016-08-15/services/MeteringService/functions/ReservedFunction/invocations
qualifier
String
Information about the service version or alias used for the invocation. For more information, see Obtain the version of an executed function.
A version number or an alias
region
String
The region where the function is deployed.
cn-shanghai
requestID
String
The unique ID of the request.
e9870cbd-2ab2-6c78-3486-cd164015b889
requestOriginalURI
String
The original Uniform Resource Identifier (URI) of the request. If a custom domain is used, this URI does not include prefixes such as
/2016-08-15./2016-08-15/services/MeteringService/functions/ReservedFunction/invocations
requestSize
Long
The size of the request payload, in bytes.
912
resolveQualifierLatency
Long
The time, in milliseconds, taken to resolve the service version.
0
responseSize
Long
The size of the response payload, in bytes.
0
runtime
String
The runtime environment of the function.
python2.7
serviceName
String
The name of the service.
test-service-name
status
Long
The HTTP status code returned to the client.
200
timestamp
Long
The timestamp when the function started processing the request, in seconds.
1538137847
userAgent
String
The user agent of the client that sent the request.
go-sdk-0.1
Understanding dashboard charts and metrics
- Log on to the Function Compute console.
In the left-side navigation pane, click Overview.
On the Overview page, in the Quick Access section in the lower-right corner, click Configure log dashboard.

On the Configure log dashboard page, find the log you want to analyze and click Analyze Log in the Actions column. You can view the following charts.
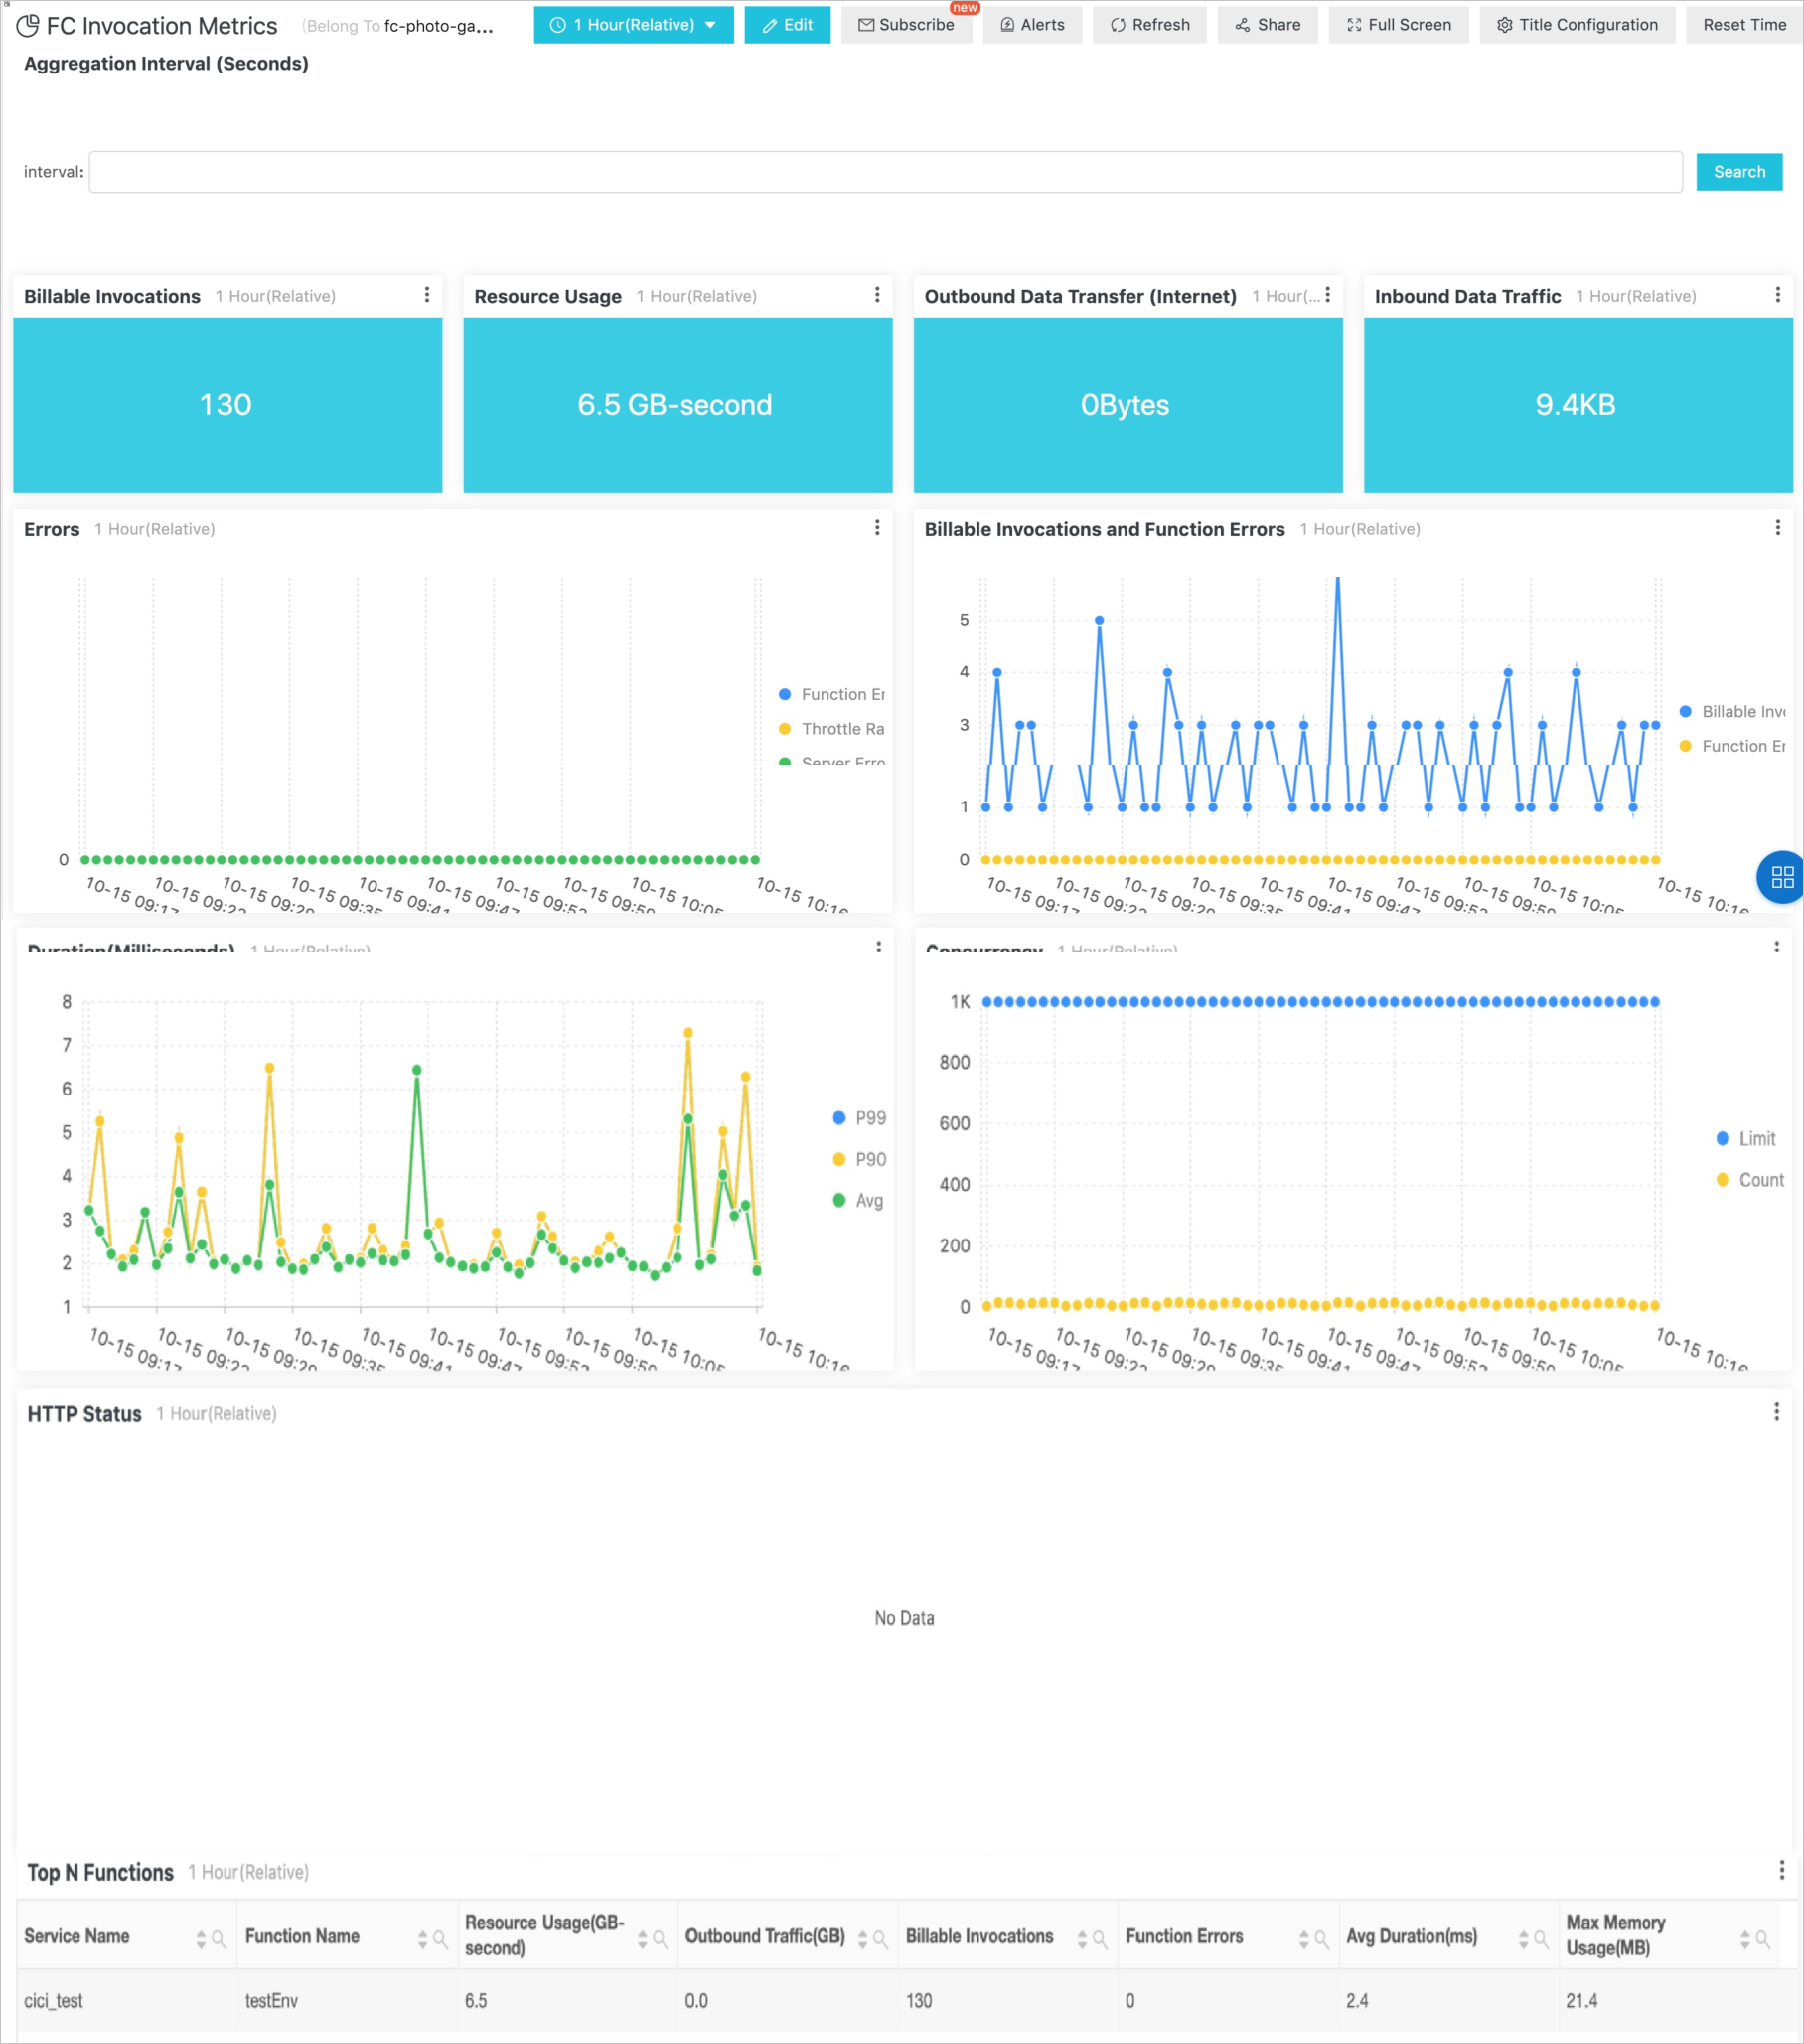
Metric
Description
Billable invocations
The number of function executions, including successful attempts and those that failed due to internal errors.
Resource usage
The product of the memory allocated to the function instance and its execution duration.
Outbound data transfer (Internet)
The billable outbound data transfer generated by the function's response. This excludes traffic from internal requests made by TCP or UDP clients.
Inbound data traffic
The inbound traffic generated when the function receives a request. This traffic is not billable.
Errors
User error rate: The percentage of function executions that failed due to non-system issues, such as code errors or 4xx client errors (excluding 429 throttling errors). The expected value is 0.
Throttling error rate: The percentage of function executions that failed due to throttling. These errors can be caused by Function Compute system limits (503) or by exceeding your account's quota (429). The expected value is 0.
System error rate: The percentage of function executions that failed due to internal Function Compute issues. System errors include 5xx server errors (excluding 503 throttling errors). The expected value is 0.
Billable invocations and function errors
Billable invocations: The number of billed function invocations.
Function errors: The number of function invocations that failed due to non-system reasons.
Duration (milliseconds)
Average: The average execution duration of the function over the selected time period.
Concurrency
Concurrency limit: Your account's concurrency quota in the current region.
Actual concurrency: The maximum number of concurrent instances used within a specific time period.
HTTP status
The HTTP status code returned to the client after an HTTP function is executed.
Each status code class represents the total number of responses returned for that class. For example, Status_4xx represents the total count of HTTP status codes from 400 to 499 returned during the selected time period.
Top N functions
By default, functions are sorted by resource usage in descending order.
Resource usage (GB-second): The product of the memory allocated to the instance and its execution duration.
Outbound data transfer (GB): The billable outbound data transfer from the function's response. This excludes traffic from internal requests made by TCP or UDP clients.
Invocations: The total number of function invocations.
Function errors: The total number of function errors.
Max memory (MB): The maximum memory used by the function.
Customize dashboards
Run query statements and add the resulting charts to a new dashboard for easy access. For more information, see:
The following query statements and chart configurations are for reference only. Use them with caution in production environments.
Analyze user IP address sources
Distribution of requests in China
Run the following query statement and select
map of Chinaas the chart type.operation:InvokeFunction | SELECT ip_to_province(IF(forwardedFor = '', ip, forwardedFor)) AS "Province", approx_distinct(IF(forwardedFor = '', ip, forwardedFor)) AS "Requests" GROUP BY "Province" LIMIT 50Distribution of requests worldwide
Run the following query statement and select
world mapas the chart type.operation:InvokeFunction | SELECT ip_to_country(IF(forwardedFor = '', ip, forwardedFor)) AS "Country", approx_distinct(IF(forwardedFor = '', ip, forwardedFor)) AS "Requests" GROUP BY "Country" LIMIT 50Geographic distribution heatmap
Run the following query statement and select
heatmapas the chart type.operation:InvokeFunction | SELECT ip_to_geo(IF(forwardedFor = '', ip, forwardedFor)) AS geo, count(1) AS count GROUP BY geo ORDER BY count DESC LIMIT 30
Analyze user agent distribution
Run the following query statement and select
pie chartas the chart type.operation:InvokeFunction | SELECT userAgent, COUNT(userAgent) AS count GROUP BY userAgent ORDER BY count DESC LIMIT 20
Top 20 most frequently accessed HTTP function URLs
Run the following query statement and select
tableas the chart type.operation:InvokeFunction and isHTTPTrigger:true | SELECT requestOriginalURI, COUNT(requestOriginalURI) AS count GROUP BY requestOriginalURI ORDER BY count LIMIT 20
Set up alerting rules
To better monitor the health of your functions, you can configure alerting rules in Simple Log Service and send notifications with a DingTalk chatbot. For more information, see Configure an alert.