This topic describes the background, scenarios, and core features of Managed Service for OpenTelemetry in Function Compute. This topic also shows you how to configure the sampling rule and enable Managed Service for OpenTelemetry.
Background information
Managed Service for OpenTelemetry adopts the OpenTracing standard and is compatible with open source communities. Managed Service for OpenTelemetry provides developers of distributed applications with various features. For example, it enables developers to query and diagnose distributed traces, dynamically discover distributed topologies, and summarize application performance in real time.
Function Compute is integrated with Managed Service for OpenTelemetry. You can use Jaeger to upload trace information so that you can track function invocation. Managed Service for OpenTelemetry helps you analyze and diagnose performance bottlenecks in a serverless architecture. This improves development and diagnostics efficiency in serverless scenarios.
Scenarios
After you configure Managed Service for OpenTelemetry for a service in Function Compute, you can record the execution time of a request in Function Compute. You can also view the cold start time for a function and record the execution time of a function. Managed Service for OpenTelemetry helps you troubleshoot the following issues:
Identify the performance bottlenecks of a function if each execution of the function times out.
Identify the cause of the long end-to-end latency if the execution time of a function is short.
Analyze and diagnose the performance bottlenecks of a function if a request involves multiple cloud services in a distributed system.
Core features
Managed Service for OpenTelemetry in Function Compute connects the entire trace. Managed Service for OpenTelemetry provides the following core features:
Automatically records the time that is spent on key steps in Function Compute. For more information, see Automatically records the time that is spent on key steps in Function Compute..
Connects to an upstream service. If a request header contains a SpanContext, Function Compute creates a child span based on the SpanContext. For more information, see Connect to an upstream service.
Connects to a downstream service. Function Compute imports the SpanContext to the function context to help you track the internal trace of a function. For more information, see Connect to a downstream service.
Allows you to view application topologies.
Allows you to view the execution of an invalid API operation and identify the cause of the error.
Automatically records the time that is spent on key steps in Function Compute.
The following figure shows the default traces that you can view after you enable Managed Service for OpenTelemetry for a service.
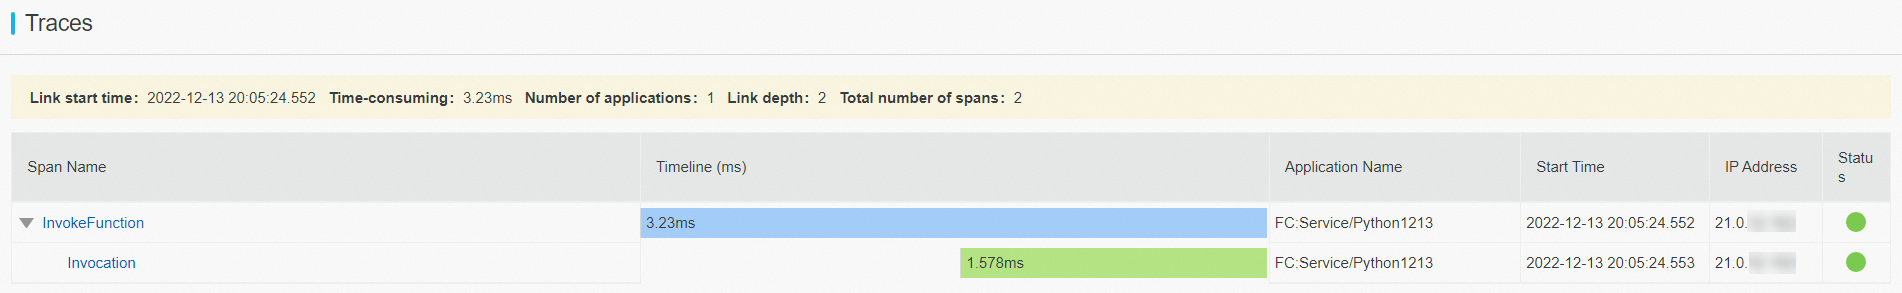
The following items describe the span names:
InvokeFunction: the total execution time of the current request in Function Compute.
ColdStart: the cold start duration of the system for the function. A cold start does not occur every time you invoke a function. A cold start occurs only when you reapply for the execution environment.
PrepareCode: the time that is taken to download code or a custom image for the function. If the time indicated by the PrepareCode span is too long, simplify the code package to reduce the time that is taken to prepare code.
RuntimeInitialization: the time that is taken to start the execution environment, including the time that is taken to start an instance and the time that is taken to perform health check on the instance. For a custom runtime and a custom image, if the time indicated by the RuntimeInitialization span is too long, check the startup behavior of the corresponding HTTP server and image.
Initializer: the time that is taken to execute the initializer function. The initializer function is executed only when a cold start occurs in the container.
Invocation: the time that is taken to execute the function. You can check the context of Invocation in the function to obtain the invocation duration.
The function generated by Function Compute is named in the format of FC:ServiceName/FunctionName.
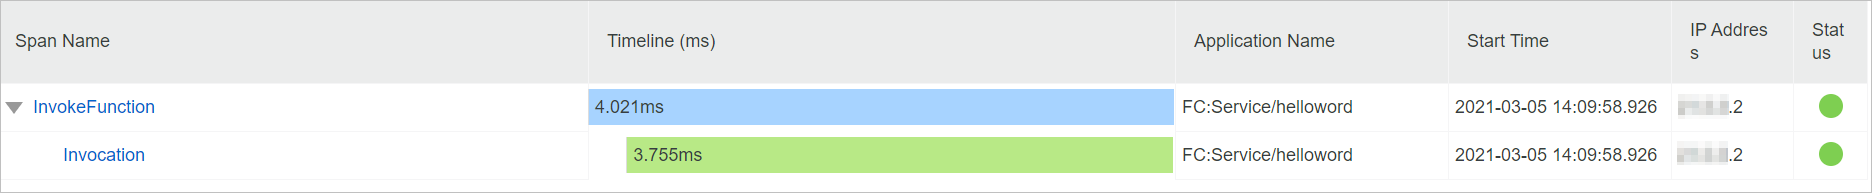
If a request does not encounter a cold start, the trace does not contain the cold start and Initializer durations. The following figure shows the trace.
Connect to an upstream service
After Managed Service for OpenTelemetry is enabled for a service, Function Compute creates a child span based on the SpanContext if a request header contains a SpanContext.
Function Compute identifies the following SpanContext headers:
x-fc-tracing-opentracing-span-context: transmits the SpanContext.x-fc-tracing-opentracing-span-context-baggage-: transmits cross-context baggage.If multiple baggage items are to be transmitted, you must transmit multiple headers, such as
x-fc-tracing-opentracing-span-context-baggage-key1: val1andtracing-opentracing-span-context-baggage-key2: val2.
The SpanContext can be injected by adding SpanContext headers when the function is invoked.
Node.js is used in the following example:
'use strict';
const FCClient = require('@alicloud/fc2');

/*
The AccessKey pair of an Alibaba Cloud account has permissions on all API operations. Using the AccessKey pair to perform operations is a high-risk operation. We recommend that you use a RAM user to call API operations or perform routine O&M.
We recommend that you do not save the AccessKey ID and AccessKey secret in your project code. Otherwise, the AccessKey pair may be leaked and the security of all resources under your account may be compromised.
In this example, the AccessKey pair is saved to the environment variables for authentication.
Configure the ALIBABA_CLOUD_ACCESS_KEY_ID and ALIBABA_CLOUD_ACCESS_KEY_SECRET environment variables in your local environment before you run the sample code.
The ALIBABA_CLOUD_ACCESS_KEY_ID and ALIBABA_CLOUD_ACCESS_KEY_SECRET environment variables are automatically configured after you configure the execution permissions in the runtime of Function Compute.
*/
var client = new FCClient('<account id>', {
    accessKeyID: process.env['ALIBABA_CLOUD_ACCESS_KEY_ID'],
    accessKeySecret: process.env['ALIBABA_CLOUD_ACCESS_KEY_SECRET'],
    region: 'cn-shanghai',
});

var serviceName = '<service name>';
var funcName = '<function name>';

async function test() {
    try {

        // Inject the SpanContext header information.
        var headers = {
            'x-fc-tracing-opentracing-span-context': '124ed43254b54966:124ed43254b5****:0:1',
            'x-fc-tracing-opentracing-span-context-baggage-key': 'val'
        };
        var resp = await client.invokeFunction(serviceName, functionName, 'event', headers = headers);
    } catch (err) {
        console.error(err);
    }
}
Connect to a downstream service
Function Compute imports a SpanContext to a function to help you track the internal trace of the function.
In a built-in runtime, the SpanContext can be obtained by using
context.tracing.In a custom runtime or custom container, the SpanContext in Function Compute can be obtained from the request header.
x-fc-tracing-opentracing-span-context: the SpanContext of InvokeFunction in Function Compute. A span is created based on the SpanContext in the function.x-fc-tracing-opentracing-span-baggages: the Base64-encoded cross-context baggage.x-fc-tracing-jaeger-endpoint: the endpoint of the Jaeger server. You can directly upload the span in the function to this endpoint.
For example, context.tracing has the following structure:
{
  "openTracingSpanContext": "5f22f355044a957a:5708f3a95a4ed10:5f22f355044a****:1",
  "openTracingSpanBaggages": {
    "key1": "val1",
    "key2": "val2"
  },
  "jaegerEndpoint": "http://tracing-analysis-dc-zb-internal.aliyuncs.com/adapt_fcfc@fcfc@fcfc/api/traces"
}
The following code provides an example on how to obtain the SpanContext from the function:
Node.js:
exports.handler = (event, context, callback) => {
  var params = {
        openTracingSpanContext: context.tracing.openTracingSpanContext,
        openTracingSpanBaggages:context.tracing.openTracingSpanBaggages,
        // jaegerEndpoint is confidential, do not print it out easily
        // jaegerEndpoint:context.tracing.jaegerEndpoint
    }
  console.log('tracing params',params)
  callback(null,'success');
}
PHP:
function handler($event, $ctx) {
    $logger = $GLOBALS['fcLogger'];
    $openTracingSpanContext = $ctx['tracing']['openTracingSpanContext'];
    $openTracingSpanBaggages = $ctx['tracing']['openTracingSpanBaggages'];
    // jaegerEndpoint is confidential, do not print it out easily
    $jaegerEndpoint = $ctx['tracing']['jaegerEndpoint'];
    $logger->info($openTracingSpanContext);
    $logger->info($openTracingSpanBaggages['key1']);
  return 'success';
}
Java:
package example;
import com.aliyun.fc.runtime.Context;
import com.aliyun.fc.runtime.StreamRequestHandler;
import java.io.IOException;
import java.io.InputStream;
import java.io.OutputStream;
public class HelloFC implements StreamRequestHandler {

    public void handleRequest(
            InputStream inputStream, OutputStream outputStream, Context context) throws IOException {
        String spanContext = context.getTracing().getOpenTracingSpanContext();
        String jaegerEndpoint = context.getTracing().getJaegerEndpoint();
        String spanBaggage = context.getTracing().getOpenTracingSpanBaggages().get("key1");
        outputStream.write(new String("success").getBytes());
    }
}
In a custom runtime or custom container, you need only to obtain the header. Go is used in the following example:
  spanContext := req.Header.Get('x-fc-tracing-opentracing-span-context')
  spanBaggages := req.Header.Get('x-fc-tracing-opentracing-span-baggages')
  jaegerEndpoint := req.Header.Get('x-fc-tracing-jaeger-endpoint')
Customize the sampling rule
To customize the sampling rule, log on to the Managed Service for OpenTelemetry console and configure the remote sampling rule. After the configuration is complete, Function Compute uses the remote sampling rule that you configured to perform sampling.
The service name that corresponds to Function Compute in Managed Service for OpenTelemetry is fc-tracing. By default, RatelimitingSampler is used, and sampling is performed at a rate of one request per second.
By default, Function Compute uses the following sampling rule:
{
  "default_strategy": {
    "type": "ratelimiting",
    "param": 1,
  }
}
Enabling method
For information about how to enable Managed Service for OpenTelemetry, see Enable Tracing Analysis.