This topic describes how to query and analyze Alibaba Cloud service events in the EventBridge console.
Prerequisites
EventBridge is activated and the required permissions are granted to a Resource Access Management (RAM) user. For more information, see Activate EventBridge and grant permissions to a RAM user.
Limits
You can query only event schemas in the OpenAPI 3.0 format.
Enable the event analysis feature
Log on to the EventBridge console. In the left-side navigation pane, click Event Buses.
In the top navigation bar, select a region.
On the Event Bus page, find the system event bus and click Details in the Actions column.
In the Basic Information section of the Event Bus Overview page, turn on Event Analysis.
In the Note message, click OK.
Query and analyze events
Log on to the EventBridge console. In the left-side navigation pane, choose .
In the top navigation bar, select a region.
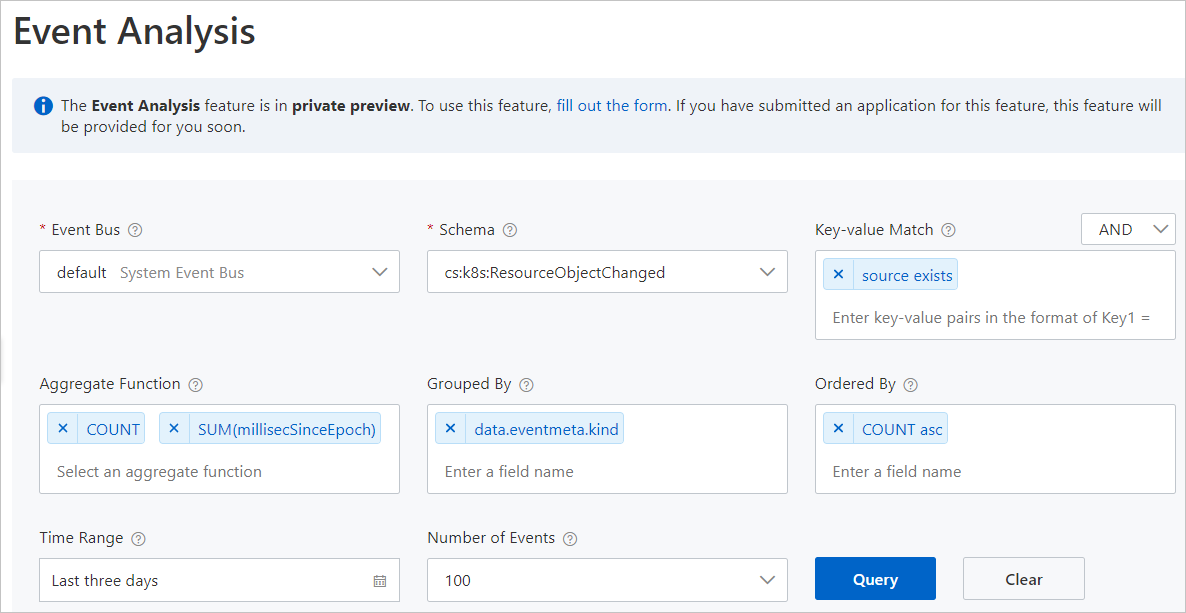
On the Event Analysis page, configure the parameters that are described in the following table and click Query.
Parameter
Required
Description
Event Bus
Yes
The name of the event bus whose events you want to query.
Schema
Yes
The schema of the event type to be queried. For more information about the types of Alibaba Cloud service events, see Alibaba Cloud service event sources.
Key-value Match
No
The key-value pair that is used to match events. You can specify one or more key-value pairs. Conditional expressions support the following operators:
=: If you use = as the operator, you must specify the value of the field. In this case, all events that meet the key = value condition are queried.!=: If you use != as the operator, you must specify the value of the field. In this case, all events that meet the key != value condition are queried.exists: All events that meet thekey existscondition are queried.does-not-exist: All events that meet thekey does-not-existcondition are queried.
NoteYou can also select AND or OR next to the Key-value Match parameter to specify the relationship between multiple key-value pairs.
Aggregate Function
No
The aggregate function that is used for data visualization. If you want to view the query results in charts, you must set the Aggregate Function parameter. You can select one or more aggregate functions. An aggregate function corresponds to a line chart.
Grouped By
No
The name of the field based on which events are grouped. If you want to group the queried events, enter a field that specifies an event property. You can enter one or more fields.
Ordered By
No
The name of the field based on which events are sorted. Events can be sorted in ascending or descending order based on the aggregate functions specified by the Aggregate Function parameter. You can enter one or more fields.
Time Range
No
The time range to query the events.
Number of Events
No
The maximum number of events to be queried.
After the preceding steps are performed, you can view the query results on the Aggregate Function and Table tabs of the Event Analysis page.
View the query results
You can view the query results on the Aggregate Function and Table tabs.
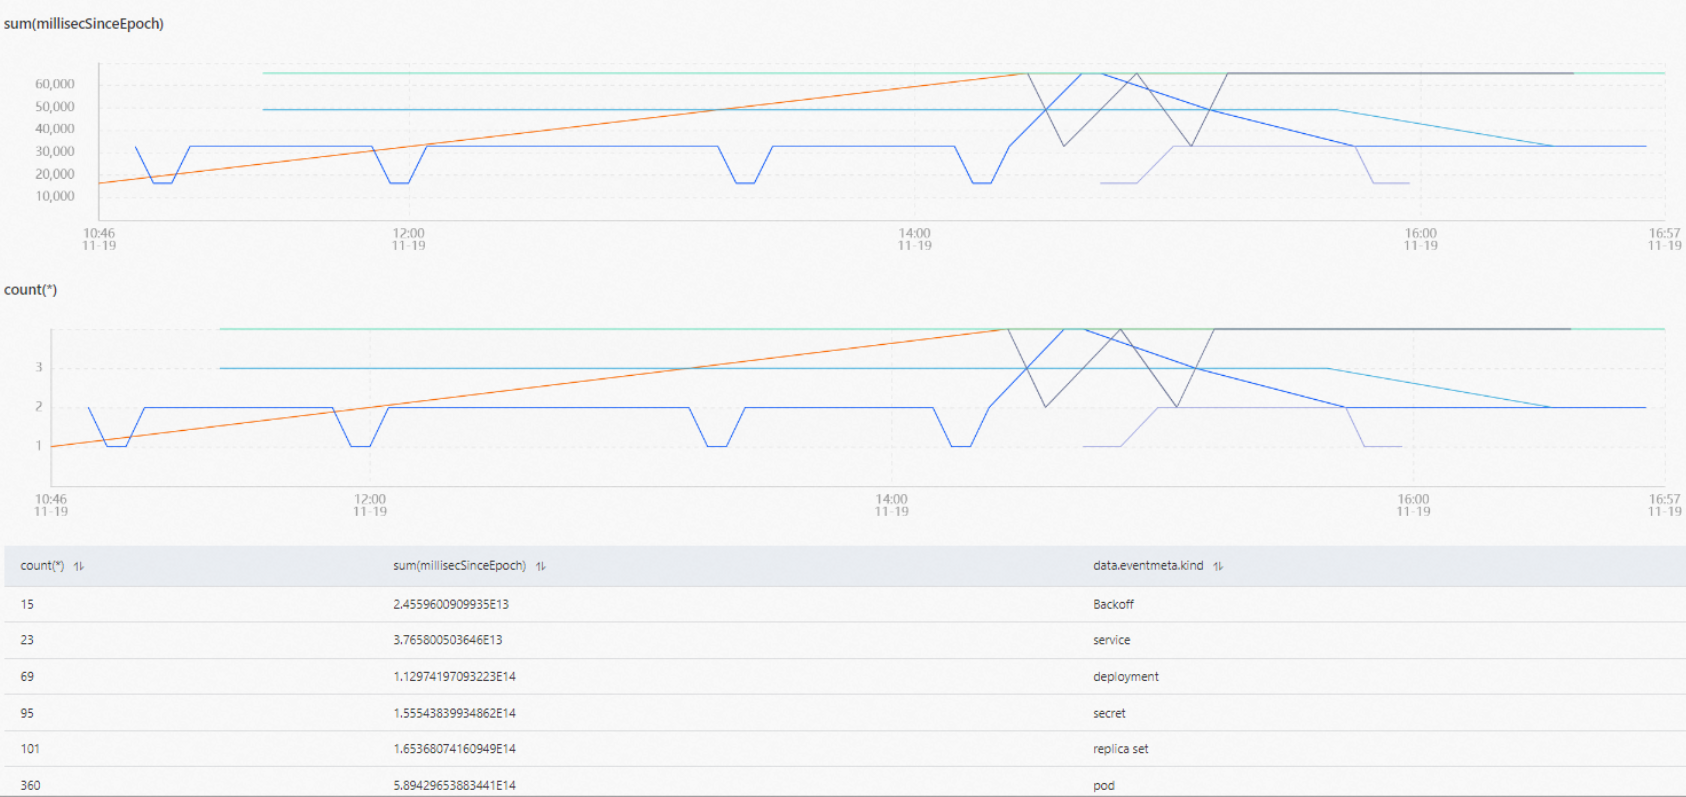
Aggregate Function
The Aggregate Function tab displays the query results in charts. The query results are displayed only after you configure the Aggregate Function parameter. The ordinate indicates the value and unit, and the abscissa indicates the time, as shown in the following figure. The lines of different colors in the charts represent different resource items of Alibaba Cloud services. For example, if Container Service for Kubernetes (ACK) events are queried, the lines of different colors represent the Deployments, ReplicaSets, and StatefulSets resource objects of ACK. For more information, see Concepts.
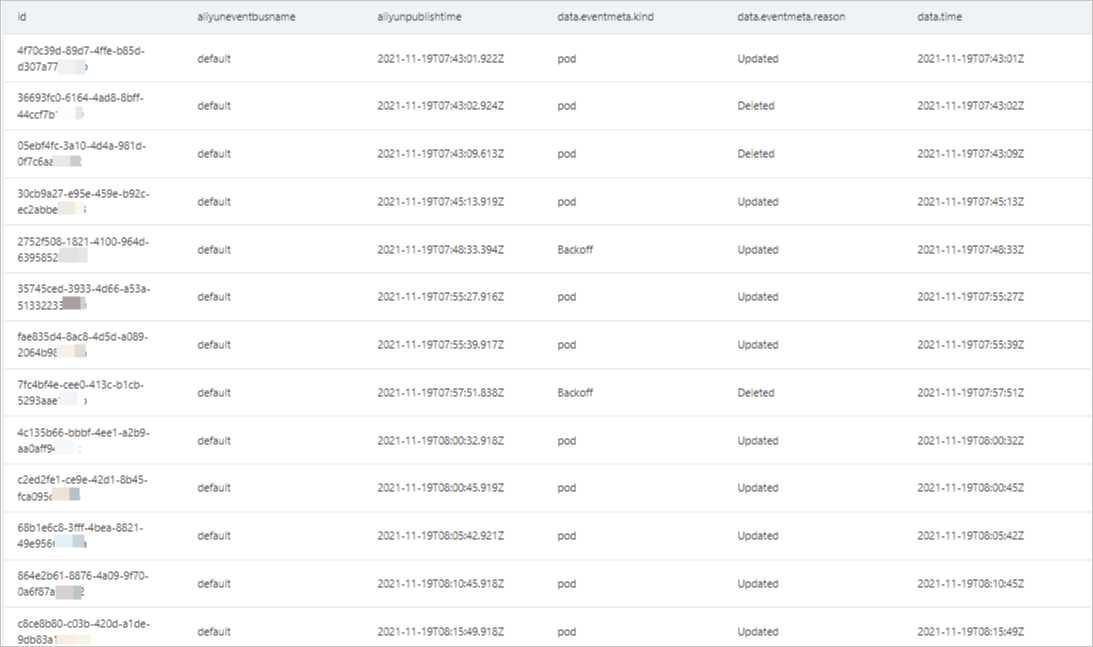
Table
The Table tab displays the query results in a table. The query results are displayed only after you configure the Ordered By parameter. The table contains critical information such as the ID of each event, the name of the event bus, and the time when each event is published, as shown in the following figure. You can view the details and trace of an event in the EventBridge console. For more information, see Overview.