When applications deployed on ECS clusters experience performance degradation, you need visibility into the underlying infrastructure to isolate root causes. EDAS host monitoring collects CPU, memory, disk, load, network traffic, and network packet metrics for each node, so you can correlate application-level issues with host-level resource constraints.
Metrics reference
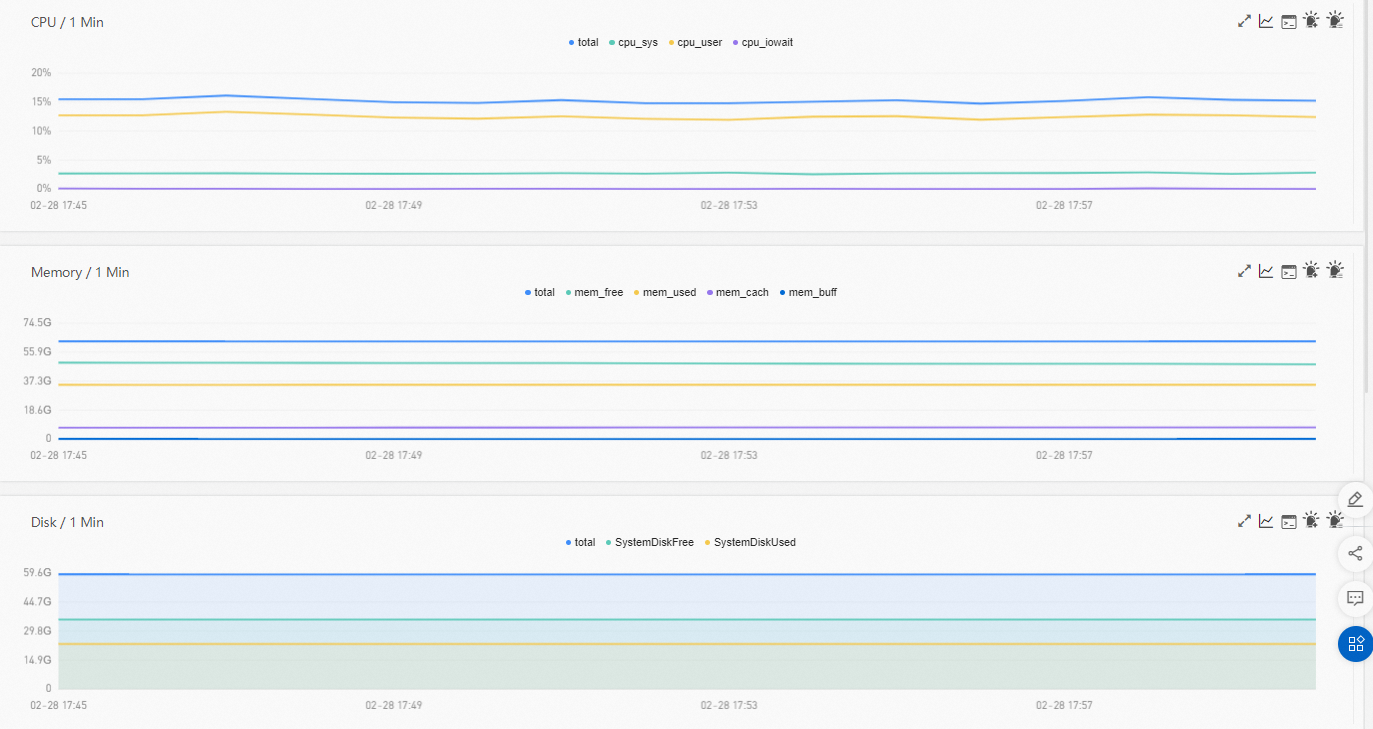
The Host Monitoring tab displays time series charts grouped into the following categories. Each chart plots one or more metrics over time.
CPU
| Metric | Description |
|---|---|
total | Overall CPU utilization across all cores. |
cpu_sys | CPU time spent on kernel (system-level) processes. A sustained high value may indicate heavy I/O operations or frequent system calls. |
cpu_user | CPU time spent on user-level processes, such as application workloads. |
cpu_iowait | CPU time spent waiting for I/O operations to complete. A sustained high value typically indicates disk or network bottlenecks. |
Memory
| Metric | Description |
|---|---|
total | Total physical memory installed on the host. |
mem_free | Memory not currently in use by any process or cache. |
mem_used | Memory actively in use by processes. This value may include cached and buffered memory depending on the calculation method. |
mem_cach | Memory used by the OS page cache for recently accessed files. The OS can reclaim this memory when processes need it. |
mem_buff | Memory used for I/O buffers, such as pending disk writes. Like cached memory, buffer memory can be reclaimed under memory pressure. |
Disk
| Metric | Description |
|---|---|
total | Total system disk capacity. |
SystemDiskFree | Free space remaining on the system disk. |
SystemDiskUsed | Space consumed on the system disk. Monitor this metric to detect disk exhaustion before it causes application failures. |
Load
| Metric | Description |
|---|---|
systemLoad | System load average -- the average number of processes in the run queue over a time interval. A sustained value above the number of CPU cores typically indicates resource contention. For example, a load of 4.0 on a 2-core host means processes are consistently waiting for CPU time. |
Network traffic
| Metric | Description |
|---|---|
traffic_bytin | Inbound network traffic (bytes received). |
traffic_bytout | Outbound network traffic (bytes sent). |
Network packets
| Metric | Description |
|---|---|
traffic_pktin | Inbound packets received. |
traffic_pktout | Outbound packets sent. |
traffic_pkterr | Packet errors. A sustained increase may indicate network interface hardware issues, driver problems, or MTU mismatches. |
traffic_pktdrp | Dropped packets. Persistent drops may point to buffer overflow, network congestion, or firewall rules discarding traffic. |
View host metrics
To access host monitoring data, navigate to the application node in the EDAS console.
Prerequisites
Before you begin, make sure that you have:
An application deployed on an ECS cluster in EDAS
Permissions to access the EDAS console and the target application
Open the Host Monitoring tab
Log on to the EDAS console.
In the left-side navigation pane, choose Application Management > Applications.
On the Applications page, configure the following filters in the top navigation bar:
Select a region.
From the Microservices Namespace drop-down list, select a microservices namespace.
From the Cluster Type drop-down list, select ECS Clusters.
Click the name of the application you want to monitor.
In the left-side navigation pane, choose Application Monitoring > Application Details.
On the Application Details page, select a node and click the Host Monitoring tab.
Interact with charts
The HOST Monitoring tab displays time series charts for CPU, Memory, Disk, Load, Network Traffic (Bytes), and Network Packets (Count).
| Action | How to |
|---|---|
| Toggle a metric | Click a metric name (for example, cpu_sys) in the chart legend to show or hide it. Each chart must have at least one visible metric. If only one metric is displayed in a chart, you cannot hide it. |
| Compare or filter by time range | Click the |
| View API details | Click the |