When cluster status turns yellow or red, or when node disk or JVM heap usage climbs toward unsafe levels, you need to know immediately — before performance degrades or data loss occurs. Alibaba Cloud Elasticsearch integrates with Cloud Monitor to deliver that visibility. Two paths are available: one-click alerts cover the most critical conditions immediately with no per-instance setup, while Cloud Monitor alerts let you customize thresholds, combine multiple metrics, and route notifications to the right contacts.
Prerequisites
Before you begin, make sure you have:
An Alibaba Cloud Elasticsearch instance
An alert contact group in Cloud Monitor. If you haven't created one, see Create an alert contact or an alert contact group
Enable one-click alerts
One-click alerts are powered by Cloud Monitor and disabled by default. Enabling this feature automatically creates alert rules for every Elasticsearch instance under your account — no per-instance configuration needed. The preconfigured rules cover:
Abnormal cluster status
Node disk usage exceeding 75%
Node JVM heap usage exceeding 85%
To enable one-click alerts:
Log on to the Alibaba Cloud Elasticsearch console.
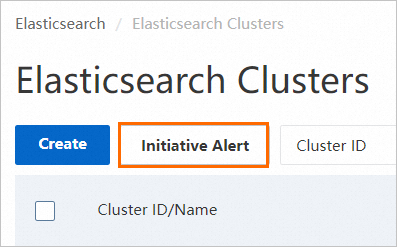
In the left-side navigation pane, click Elasticsearch Clusters.
On the Elasticsearch Clusters page, click Initiative Alert.
In the Initiative Alert dialog box, click Enable Now.
If the button displays Disable Now, the one-click alert feature is already enabled. No further action is needed.
In the Cloud Monitor console, enable the Proactive Alerting switch for the Elasticsearch service.
To verify that the feature is active:
In the Elasticsearch console, click the target instance ID on the Elasticsearch Clusters page.
In the left navigation pane, choose Monitoring and Logs > Cluster Monitoring.
Click the Basic Monitoring tab and check the Initiative Alert status in the top-right corner. If Initiative Alert shows Enabled, the feature is active.

Configure Cloud Monitor alerts
Use Cloud Monitor alerts when you need custom thresholds, multi-metric conditions, or fine-grained notification routing. The steps below show an example that combines cluster status, node disk usage, and node heap memory usage into a single combined-metric rule.
Recommended metrics and thresholds
Configure alert rules based on the metrics and thresholds in the following table. For detailed metric descriptions and troubleshooting guidance, see Metric descriptions and troubleshooting suggestions.
| Metric | Required | Alert threshold | Notes |
|---|---|---|---|
| Cluster Status | Yes | >= 2 (Yellow or Red) | Green = 0, Yellow = 1, Red = 2 |
| NodeDiskUtilization(%) | Yes | >= 75%; do not exceed 80% | |
| NodeHeapMemoryUtilization(%) | Yes | >= 85%; do not exceed 90% | |
| NodeCPUUtilization(%) | Optional | < 95% | |
| Node Workload Within One Minute | Optional | 80% of CPU core count | Use as a reference value |
| ClusterQueryQPS (Count/Second) | Optional | Based on test results | |
| ClusterIndexQPS (Count/Second) | Optional | Based on test results | |
| Full GC Count | Optional | Any value > 0 indicates an issue | |
| Exception Count | Optional | Any value > 0 indicates an issue | |
| Snapshot Status | Optional | -1 or 0 = normal; 2 = abnormal |
Create an alert rule
Go to the Cloud Monitor console.
In the left navigation pane, choose Alert > Alert Rules.
Click Create Alert Rule.
On the Create Alert Rule page, configure the following parameters. For parameters not listed here, use the default values. For a full parameter reference, see Create an alert rule. Configuring the rule description (combined metrics): Click Add Rule > Combined Metrics. In the Configure Rule Description panel, enter an Alert Rule name and set the following:
Metric Type: Combined Metrics
Alert Level: Warning (Warn)
Multi-metric Alert Condition — click Add Metric to add each metric:
Metric 1: Cluster ID > ClusterStatus, value >= 2
Metric 2: nodeName > Node Disk Usage, average >= 75%
Metric 3: nodeName > Node Heap Memory Usage_ES Business, average >= 85%
Relationship Between Metrics: Generate alert If one of the conditions is met (||)
Alert Threshold Triggers: 3 Consecutive Cycles (1 Cycle = 1 Minutes)
To route alerts to an external system, expand Advanced Settings and enter a publicly accessible URL in the Alert Callback section. Cloud Monitor sends alert data to this URL via HTTP POST requests. Only HTTP is supported. For details, see Use alert callbacks.
Parameter Value Product Select Elasticsearch Resource Range Select Instances Associated Resources Add the instance to monitor Rule Description See the combined-metric example below Alert Contact Group Select a contact group Click OK. When an alert triggers, the configured contact group receives a notification via the configured channel.
Example: Configure disk alerts
To monitor disk usage at multiple severity levels, follow the steps in Create an alert rule and use a Simple Metric rule with the following configuration:
| Parameter | Example value |
|---|---|
| Alert Rule | Disk Usage Alert |
| Metric Type | Simple Metric |
| Metric | nodeName > Node Disk Usage |
| Threshold and alert level | Critical: average >= 80% for 3 consecutive epochs |
| Warning: average >= 75% for 3 consecutive epochs | |
| Info: average >= 70% for 3 consecutive epochs | |
| Chart Preview | Preview of the monitoring chart for the selected metric |
What's next
Review Metric descriptions and troubleshooting suggestions to understand what each metric indicates and how to respond when an alert fires.
Create alert contacts or contact groups if you haven't already: Create an alert contact or an alert contact group.