Arthas is a tool that enables developers to diagnose the online issues of Java applications.
It adopts the bytecode enhancement technology, which allows developers to check the
status of applications without the need to restart the running Java virtual machine
(JVM) processes. The Enterprise Distributed Application Service (EDAS) console supports
the general features of Arthas. Such features include JVM overview, time consumption
analysis for threads, analysis of function execution, and performance analysis.
Prerequisites
Before you use Arthas to diagnose an application, make sure that the following requirements
are met:
- The EDAS application is deployed in a Kubernetes cluster.
Note In this example, a Container Service for Kubernetes (ACK) cluster is used.
- The application is developed in Java.
- Port 3658 or 8563 is not occupied.
Background information
Arthas is an open source Java diagnostics tool that is developed by Alibaba Cloud.
It is popular among developers. For more information about Arthas, see the Arthas Documentation.
Update arms-pilot and restart an application
Before you use Arthas to diagnose an application, you must update arms-pilot and restart
the application.
Notice The update of arms-pilot does not affect your applications. However, we recommend
that you do not release, restart, or roll back the applications during the update
of arms-pilot.
To update arms-pilot for an ACK cluster and restart an application, perform the following
steps:
- Update arms-pilot.
- Log on to the ACK console.
- In the left-side navigation pane, click Clusters.
- On the Clusters page, click the name of the cluster that you want to manage, or click Details in the Actions column of the cluster.
- In the left-side navigation pane, choose .
- On the Deployments page, select arms-pilot-system or arms-pilot from the Namespace drop-down list.
- Find the deployment that is named arms-pilot-ack-arms-pilot and choose in the Actions column.
- In the Redeploy message, click Confirm.
- If mse-pilot is installed in your cluster, you must update mse-pilot after you update
arms-pilot.
- On the Deployments page, select mse-pilot from the Namespace drop-down list.
- Find the deployment that is named arms-pilot-ack-arms-pilot and click Edit in the Actions column.
- On the Edit page, set the image tag to v1.29. Then, click Update.
Notice The update of mse-pilot does not affect your applications. However, we recommend that
you do not release, restart, or roll back the applications during the update of mse-pilot.
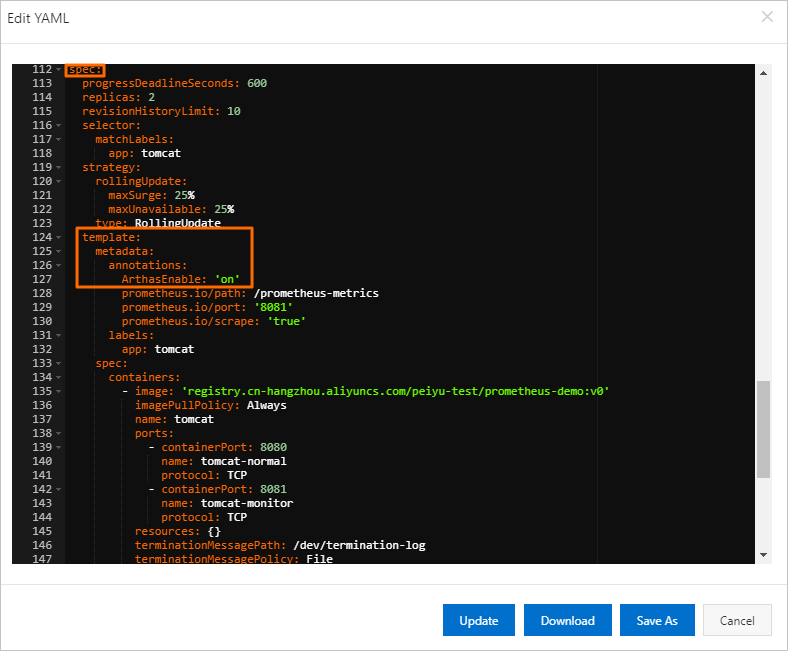
- If the process identifier (PID) of the monitored application is 1, modify the YAML
configuration file of the application.
- On the Deployments page, select the namespace of the application from the Namespace drop-down list. Find the deployment that you want to manage and choose in the Actions column.
- In the Edit YAML dialog box, add the following information to spec > template > metadata > annotations: ArthasEnable: 'on'. Then, click Update.
Note If the annotations section is not available in metadata, you must add annotations: before you add ArthasEnable: 'on'.
- Restart an application.
- On the Deployments page, select the namespace of the application from the Namespace drop-down list. Find the deployment that you want to manage and choose in the Actions column.
- In the Redeploy message, click Confirm.
Go to the Arthas Diagnosis page
- Log on to the EDAS console.
- Go to the Application Overview page by using one of the following methods:
- In the left-side navigation pane, choose or . In the top navigation bar, select a region. In the upper part of the page, select
a microservice namespace. On the Container Service Kubernetes Clusters or Serverless Kubernetes Clusters page, click a cluster ID. In the Applications section of the Cluster Details page, click the name of the application that you want to manage.
- In the left-side navigation pane, click Applications. In the top navigation bar, select a region. In the upper part of the page, select
a microservice namespace. Select Container Service or Serverless Kubernetes Cluster from the Cluster Type drop-down list and click the name of the application that you want to manage.
- In the left-side navigation pane of the application details page, choose .
- On the Arthas Diagnosis page, select the pod of the application.
- If Arthas has not been downloaded, you must redeploy the Application Real-Time Monitoring
Service (ARMS) agent to download Arthas. For more information, see Step 1.
- If Arthas has not been mounted, EDAS automatically redeploys the application to mount
Arthas to the application. For more information about how to manually redeploy the
application, see Step 4.
- If the attempt to mount Arthas failed, you must check the PID of the application and
perform one of the following operations as required:
- If the application PID is 1, modify the YAML configuration file of the application.
For more information, see Step 3.
- If the application PID is not 1, contact EDAS technical support.
JVM overview tab
On the JVM overview tab, you can view the JVM information about the application, including
the statistics on JVM memory and the information about the operating system and variables.
This tab provides an overview of the JVM of the application.
By default, after you go to the Arthas Diagnosis page, the JVM overview tab appears. The JVM overview tab displays information in the following sections:
Thread time-consuming analysis tab
On the Thread time-consuming analysis tab, you can view all the threads of the application
and the stack information about each thread. This tab helps you efficiently identify
the threads that consume a long time.
- On the Arthas Diagnosis page, click the Thread time-consuming analysis tab.
The Thread time-consuming analysis tab displays all the threads of the application sorted by CPU utilization in descending
order. This tab also displays the details of each thread, including the name, ID,
CPU utilization, and status.
- To view the stack information about a thread, click View in the Actions column of the thread.
Method execution analysis tab
On the Method execution analysis tab, you can view the information about a function
execution that is randomly captured by the system, such as the duration, input parameters,
and return value. You can also drill down to an internal function that is executed
within the function. The analysis of function execution is applicable to scenarios
in which a function execution is difficult to reproduce in the offline environment
or logs are missing.
- On the Arthas Diagnosis page, click the Method execution analysis tab.
- On the Method execution analysis tab, select a service and click OK.
Notice After you select a service, EDAS attempts to identify the class and function that
correspond to the service code. If the attempt fails, you must specify the corresponding
class and function.
The details tab of a function displays the information about a random execution of
the function, including the name, duration, input parameters, return value, errors,
and internal functions. The internal function whose execution consumes the most time
is highlighted in red in the Timeline(ms) column.
- Optional:To drill down to an internal function, find the internal function and click Drill in in the Actions column.
The details tab of an internal function displays the information about the captured
execution of the internal function, including the name, duration, input parameters,
return value, errors, and deeper-level internal functions. The deeper-level internal
function whose execution consumes the most time is highlighted in red in the Timeline(ms)
column.
- To set filter conditions for capturing a specific function execution, perform the
following steps:
- On the details tab of the selected function, click Modify diagnostic parameters in the upper-right corner.
- In the Diagnostic parameter setting dialog box, set the parameters as required and click OK.
| Parameter |
Description |
Example |
| Only when an exception is thrown |
Specifies whether to capture only a function execution that returns an error. Valid
values:
- True: captures only a function execution that returns an error.
- False: captures a function execution regardless of whether it returns an error.
|
False |
| Time consuming is greater than |
The execution duration. A function execution can be captured only when its duration
exceeds the specified value. Unit: ms.
|
30 |
| Object deserialization level |
The deserialization level of a function execution whose parameters and return value
are complex objects. A greater value indicates a deeper deserialization level, which
means that more internal fields of complex objects can be displayed.
|
5 |
| Add parameters |
The filter condition to set a limit on the parameters of a function execution. Example:
|
params[0].userId ; = ; 8753 |
- Click the
 icon.
icon. Then, the details tab of the selected function displays the information about the
function execution that meets the filter conditions.
- Optional:To view the source code of the function, click View method source code in the upper-right corner of the details tab.