This article shows how to troubleshoot and resolve high CPU utilization on a Windows ECS instance.
Problem description
You may experience the following symptoms on your Windows ECS instance:
The system becomes sluggish, service response times increase, and application performance degrades.
When you monitor the instance in the ECS console, you notice that the CPU utilization or load is high. As a general guideline, CPU utilization is considered high if it exceeds 80%, and the load is high if it exceeds 0.5.
You receive alert notifications indicating that CPU utilization or load has exceeded the configured threshold.
Possible causes
High CPU utilization can be caused by the following:
The ECS instance is infected with malware, such as a virus or trojan.
Third-party antivirus software on the ECS instance is consuming high CPU resources.
Application exceptions on the ECS instance, such as business processes running at full capacity due to CC attacks, code with infinite loops, driver exceptions, high I/O usage, or applications that cause frequent interrupts.
Procedure
Check CPU utilization with Resource Monitor
This section uses Resource Monitor on a Windows Server 2022 instance to show how to diagnose the cause of high CPU utilization. For more information about other common tools, see Common tools.
Connect to the ECS instance by using VNC.
For more information, see Connect using VNC.
At the bottom of the desktop, click the Search icon, enter
Resource Monitor, and then click OK.In the Resource Monitor window, check whether any processes have excessively high CPU utilization.
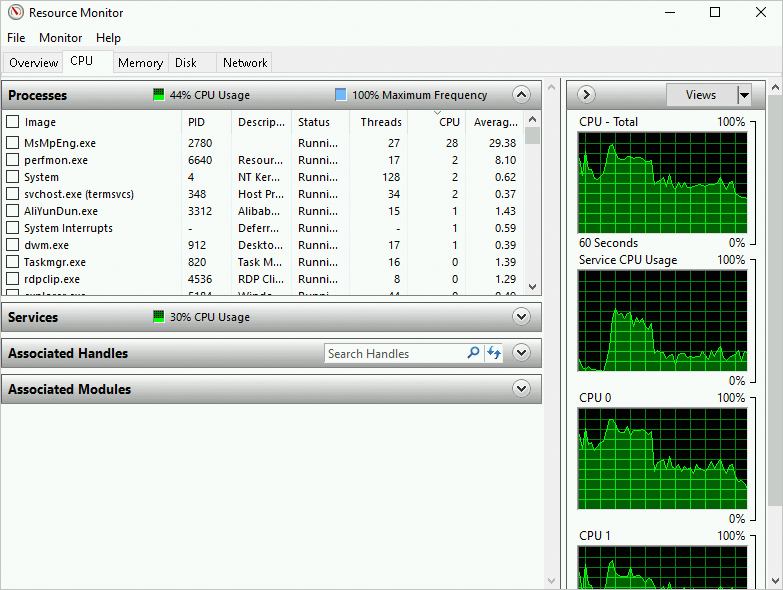
For processes that consume high CPU resources, note their process IDs (PIDs) and program names.
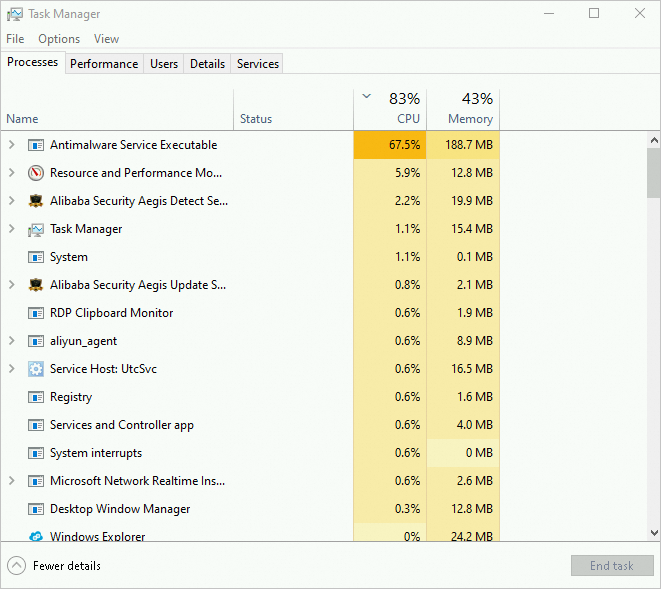
Open Task Manager. On the Details tab, find the abnormal process name and its corresponding PID that you identified in Resource Monitor. Right-click the process name and select Open file location to determine if the process is a malicious program.
Resolve high CPU utilization
The following table describes common causes of high CPU utilization and their solutions.
Symptom | Cause | Solution |
An abnormal user program or process persistently consumes a large amount of CPU resources, resulting in high CPU utilization and load. | The application is malfunctioning or poorly optimized, causing it to consume excessive CPU resources. |
|
A normal user program or process consumes a large amount of CPU resources for an extended period, resulting in high CPU utilization and load. | A business-critical application requires more CPU resources than the instance provides. | If the CPU of the instance becomes a performance bottleneck, consider the following solutions based on your business requirements:
|
A single business program or process occasionally experiences high CPU utilization and load, but the duration is short and the frequency is low. | The business program needs to be optimized to handle high CPU resource consumption triggered by special business scenarios, such as encryption, decryption, and high concurrency. | Optimize the business program. |
No single program or process consumes a large amount of CPU resources, but the overall CPU utilization is high and the load is low. | The CPU resources required for the normal operation of services on the instance exceed the CPU capacity of the instance. | If the instance's CPU is the bottleneck, upgrade the instance type. For more information, see Change the instance types. |
Common tools
This section describes Windows tools that help identify the cause of high CPU utilization.
Task Manager
Task Manager displays a list of applications, helping you find those that consume high CPU resources. The following figure shows the Task Manager window.
When you check the CPU utilization on the Performance tab, right-click the CPU utilization graph and select .
The following figure shows the utilization of two logical CPUs.
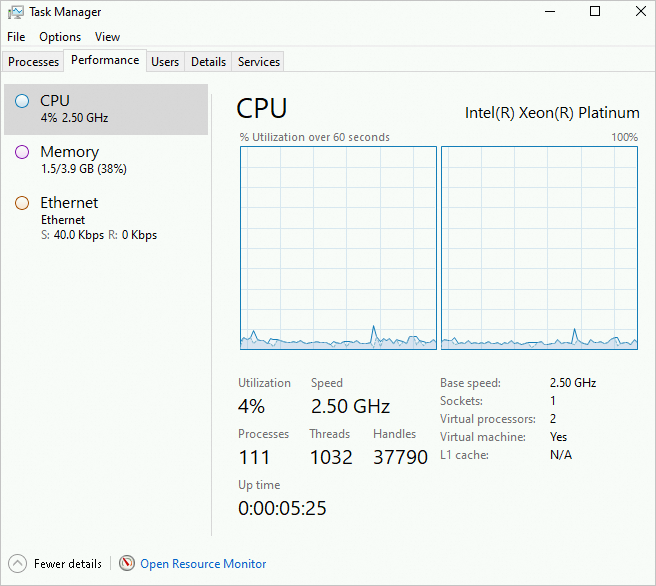
If the CPU utilization of a single process spikes to nearly 100% while the utilization of other processes remains low, the cause may be related to network I/O processing.
Resource Monitor
Resource Monitor provides a clear view of CPU utilization and allows you to search for processes by their associated handles and modules.
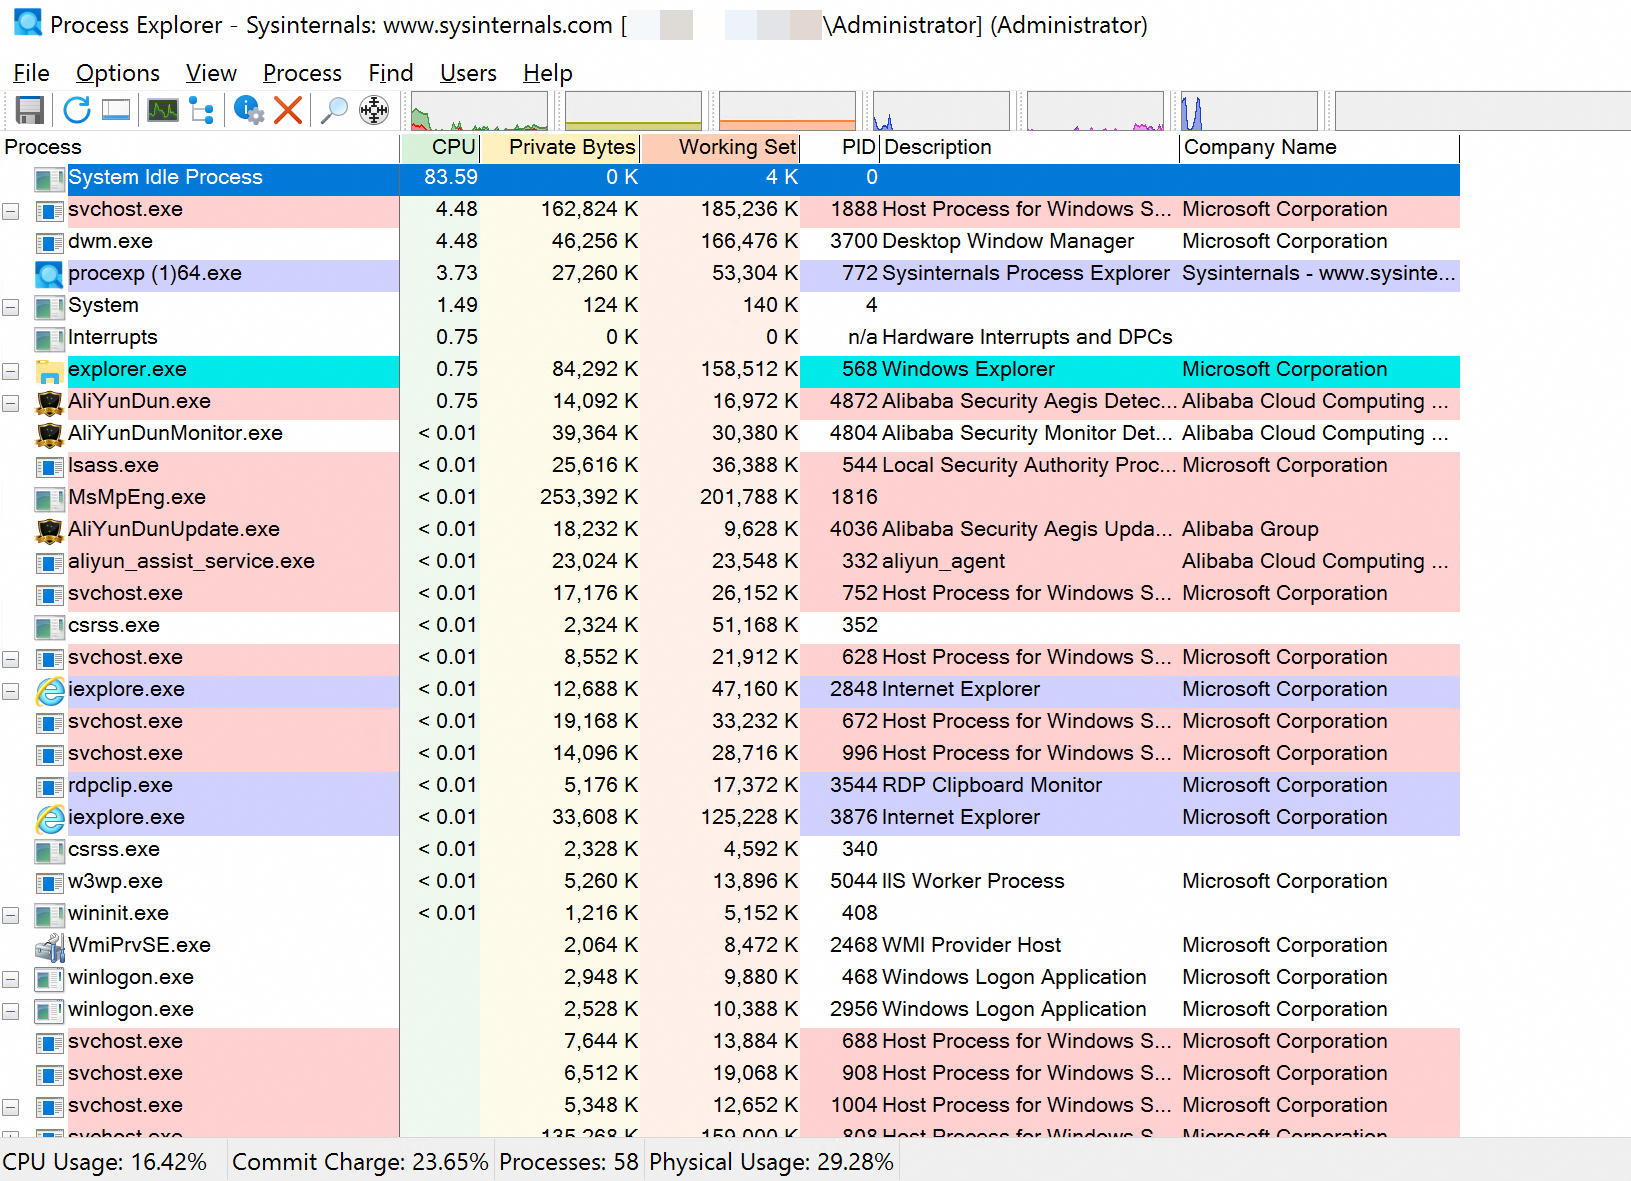
Process Explorer
Process Explorer is a Microsoft Sysinternals tool. By configuring the correct symbols, you can inspect the call stack of an application's threads to locate potentially problematic drivers. To download Process Explorer, see Process Explorer.
The following figure shows the Process Explorer tool window.
Performance Monitor
Performance Monitor is a Microsoft tool for collecting performance counters from various components. To analyze system CPU resource consumption, you can check several counters.
Performance Monitor has the following three core parameters:
\Processor(_Total)\% Processor Time: The percentage of elapsed time that the processor spends executing a non-idle thread.\Processor(_Total)\% Processor Time=\Processor(*)\% User Time+\Processor(*)\% Privileged Time.\Processor(*)\% User Time: The time spent executing program code in user mode. It can help you determine which application or function call consumes the most time.\Processor(*)\% Privileged Time: The percentage of time that an application spends executing system calls in kernel mode (privileged mode), such as for drivers, IRPs, and context switches. If the operating system spends more than 30% of its time inPrivileged Time, the instance is likely performing high I/O throughput operations.When
% Privileged Timeis high, you need to further check the% DPC Time,% Interrupt Time, andContext Switches/seccounters.High
% DPC Timeand% Interrupt Timevalues indicate that an unknown device is performing a large number of operations or has poor performance.A high
context switchvalue means the kernel is frequently switching between processes or threads on the CPU. For more information, see The Case of the 2 Million Context Switches and Mark Russinovich's The Case of the System Process CPU Spikes.A high
Context Switches/secvalue indicates that a large number of threads are in the Ready state. To resolve this issue, you need to reduce the number of threads.
Reference
To resolve high CPU utilization on a Linux system, see Troubleshoot and resolve high CPU utilization or load issues on Linux instances.