My Traceroute (MTR) combines traceroute and ping into a single tool that continuously probes every hop on a network path and reports per-hop statistics — packet loss rate, average latency, and standard deviation — in real time. This makes it far more reliable than a single ping or traceroute snapshot for diagnosing connectivity problems and latency issues on ECS instances.
Key takeaways before you start:
MTR continuously updates statistics, so a single asterisk or high-loss hop does not always mean a real network problem — check whether loss persists on subsequent hops.
Paths are asymmetric. Run MTR in both directions (client to server and server to client) to pinpoint where the issue actually lives.
ICMP throttling is common at carrier nodes. If loss or high latency appears at a hop but the subsequent hops return to normal, the hop is deprioritizing ICMP probes — not dropping your traffic.
How it works
A network path from a client to a destination server typically spans three regions:

Use an IP address lookup site such as IPLark to find the public IP address of your local network. In the diagram, "client" refers to the public IP address of the client machine, and "server" refers to the domain name or public IP address of the destination server.
| Region | Description | Who to contact if there's a problem |
|---|---|---|
| Region A — Client's local network | LAN and local carrier networks | Your network admin (LAN) or your local carrier |
| Region B — Carrier backbone | Backbone networks of multiple carriers | Identify the carrier by looking up the hop IP address, then contact that carrier or Alibaba Cloud after-sales support |
| Region C — Destination server's network | The carrier network hosting the destination server | The carrier |
When intermediate nodes on a path are load-balanced, MTR only probes and collects statistics for the start and end nodes of the load-balanced segment. Other nodes in the segment display only IP address or domain name information.
Install MTR
Windows
WinMTR requires no installation. Download and run it directly:
Download WinMTR from the WinMTR official website.
Decompress the package and double-click
WinMTR.exeto start it.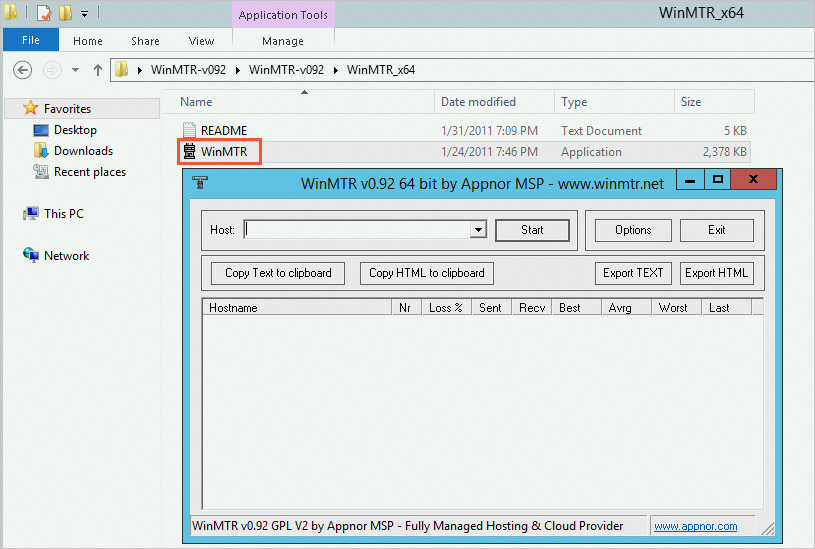
Run a test
Linux — mtr command
Syntax
mtr [options] hostname/iphostname: domain name of the destination serverip: public IP address of the destination server
Common options
| Option | Description |
|---|---|
-r or -report | Run in report mode (outputs a summary instead of the live TUI) |
-c <count> | Number of packets to send per hop (default: 10) |
-n or -no-dns | Display numeric IP addresses only; skip DNS resolution |
-4 | Use IPv4 only |
-6 | Use IPv6 only |
-s or -psize | Size of each ping packet |
-p or -split | Display results in split-user interface format |
-a or -address | Set the source IP address (useful when the host has multiple IP addresses) |
Run man mtr to see all available options.
By default,mtropens an interactive terminal UI. Press?orhto display the help menu, which lets you control MTR behavior and switch between display views.
Example: IPv4 test
sudo mtr -4 www.aliyun.comReading the output
| Field | Description |
|---|---|
Host | IP address or domain name of the hop node. Press n to toggle between IP and hostname display. |
Loss% | Packet loss rate at this hop |
Snt | Number of packets sent (default: 10; set with -c) |
Last | Latency of the most recent probe |
Avg | Average latency across all probes |
Best | Lowest latency recorded |
Wrst | Highest latency recorded |
StDev | Standard deviation of latency — a higher value means more variation between probes |
Windows — WinMTR
In the WinMTR window, enter the IP address or domain name of the destination server in the Host field. Configure optional parameters as needed:
ImportantThe IP address or domain name cannot contain spaces.
Option Description Interval (sec) Time between probes. Default: 1 second Ping size(bytes) Size of each probe packet. Default: 64 bytes Max. hosts in LRU list Maximum number of hosts on the least recently used (LRU) list. Default: 128 Resolve names Display hostnames instead of IP addresses 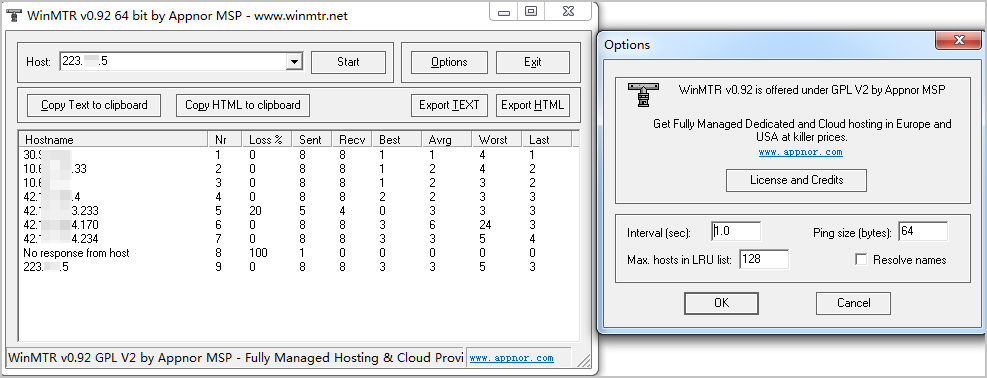
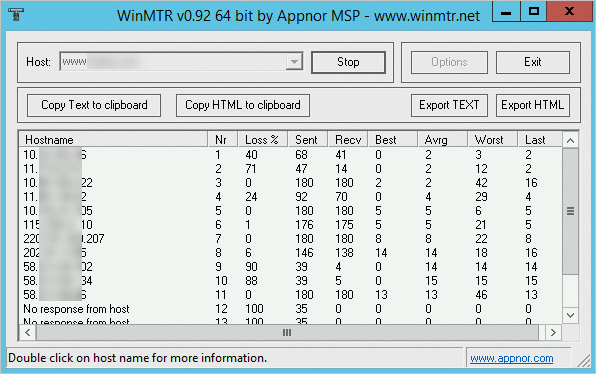
Click Start. The button changes to Stop and WinMTR displays results in real time.
Let the test run for at least a few minutes, then click Stop. To export results, use one of these options:
Option Description Copy Text to clipboard Copy results as plain text Copy HTML to clipboard Copy results as HTML Export TEXT Save results to a plain text file Export HTML Save results to an HTML file
Reading the output
| Field | Description |
|---|---|
Hostname | IP address or domain name of the hop node |
Nr | Hop number |
Loss% | Packet loss rate at this hop |
Sent | Number of packets sent |
Recv | Number of packets received |
Best | Lowest latency recorded |
Avg | Average latency across all probes |
Worst | Highest latency recorded |
Last | Latency of the most recent probe |
StDev | Standard deviation of latency |
Analyze the test results
This section explains how to interpret the metrics MTR reports and how to distinguish real network issues from expected behavior such as ICMP throttling.
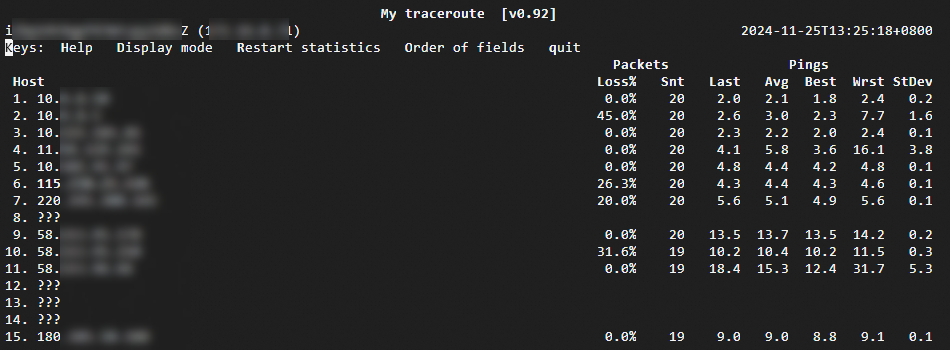
The following sample output is used in the analysis below:
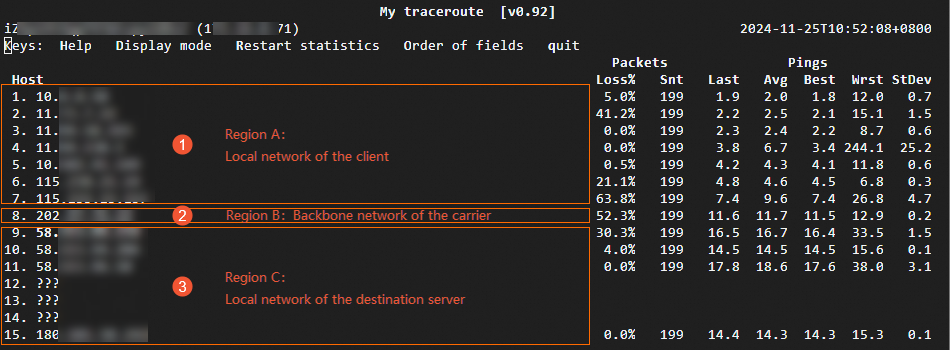
Loss%
Non-zero loss at a hop does not always mean there is a network problem. Two common causes:
ICMP throttling by the carrier — The carrier deprioritizes ICMP probes for security or performance reasons, causing apparent packet loss that does not affect actual traffic.
A real network exception — Packets are genuinely dropped at that hop.
To tell the difference, check the hops that follow:
No loss on subsequent hops — The loss at this hop is caused by ICMP throttling. No action needed. (See hop 2 in the sample output.)
Loss on all subsequent hops — A real network exception at this hop is dropping packets. Investigate and contact the responsible carrier. (See hop 6 in the sample output.)
Loss on some subsequent hops, with varying rates — Both ICMP throttling and a network exception may be present. Use the loss rate of the last few affected hops as the reference value. In the sample output, hops 6–9 show loss, with hop 9 at 30.3% — use hop 9's rate as the reference.
Avg and StDev
Avg reflects overall latency at a hop, but a single Avg value can be misleading when StDev is high. For example, if some packets have 25 ms latency and others have 350 ms, the Avg might fall in a normal range while actual performance is inconsistent.
Use both values together:
High StDev — The
Avgalone is unreliable. ExamineBestandWrstto assess the actual range of latency at this hop.Low StDev — The
Avgaccurately reflects the latency at this hop.
There is no fixed threshold for "high" or "low" StDev — it is always relative to the other latency values at the same hop. For example, a StDev of 25 ms is high whenAvgis 30 ms, but not high whenAvgis 325 ms.
Latency spikes
Spike starting at a hop — If latency increases sharply at a hop and remains elevated on subsequent hops, a network exception likely occurred at that hop. (In the sample output, latency spiked starting at hop 6.) A latency spike alone does not confirm packet loss — run a reverse path test to confirm.
Spike confined to a single hop — If latency is high at a hop but drops back to normal on the next hop, ICMP throttling at that hop is the most likely cause. In the sample output, hop 9 has 30.3% loss and a latency spike, but subsequent hops return to normal levels.
Run a reverse path test
Network paths are asymmetric — the route from client to server often differs from the return route. If a one-way test does not pinpoint the issue, run the test in both directions.
When you have shell access on both ends:
From the client, run:
mtr --report <server-ip-or-hostname>From the server, run:
mtr --report <client-public-ip>
When the client is behind NAT and has no stable public IP:
Run MTR from a small cloud VM or a stable public endpoint that both the client and server can reach, testing both legs of the path separately.
Sample analysis
Based on the sample output above:
Hops 2, 6, 7, 8, 9 show packet loss, but hops 3, 4, 5, 10, 11, and 15 do not. Because the loss is not continuous across all subsequent hops, this pattern is consistent with ICMP throttling rather than real packet loss.
Hop 4 has an elevated
Wrstvalue but a normalAvg— this indicates a brief latency spike during a single probe cycle, likely caused by transient network or device fluctuation rather than a sustained issue.Average latency across all hops ranges from 1.8 ms to 17.6 ms, well within the expected range for a same-region or nearby-region path.
Conclusion: No real network exceptions on this path. The observed loss and latency spikes are consistent with ICMP throttling at intermediate carrier nodes.
The analysis above illustrates a common interpretation method. Always evaluate results in the context of your actual business scenario. If a one-way test does not lead to a clear conclusion, run a reverse path test.
Common failure scenarios
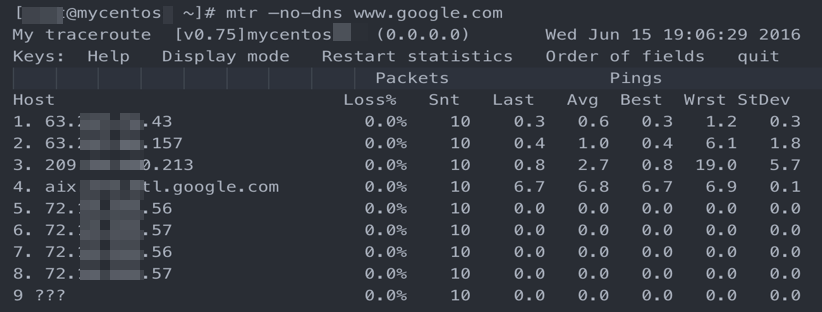
The examples below were captured on Linux using mtr. Output format varies by operating system and tool.Misconfigured destination host
All packets are lost at the final hop.
ICMP is likely blocked by the destination server's security policies (firewall rules or iptables). Check the security policies on the destination server.
ICMP throttling at the destination
Packet loss is high at the last few hops.
The destination server's firewall, iptables rules, or a carrier throttling policy is blocking ICMP responses. Check the destination server's security policies or run a reverse path test to isolate the cause.
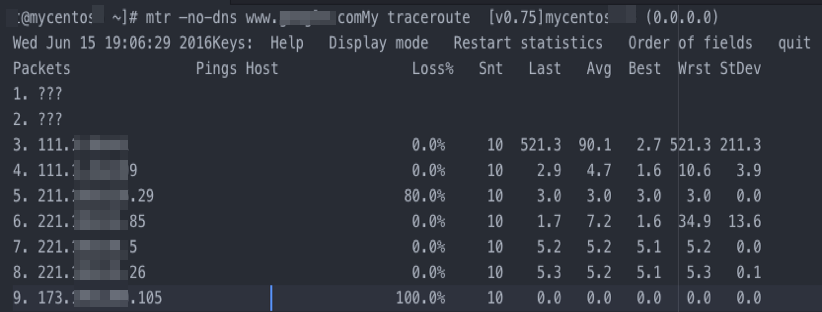
Routing loop
Packets loop through the same hops repeatedly after a certain point and never reach the destination.
In the example, a routing loop starts at hop 5. This is usually caused by a misconfigured route on a carrier node. Contact the carrier to resolve the issue.
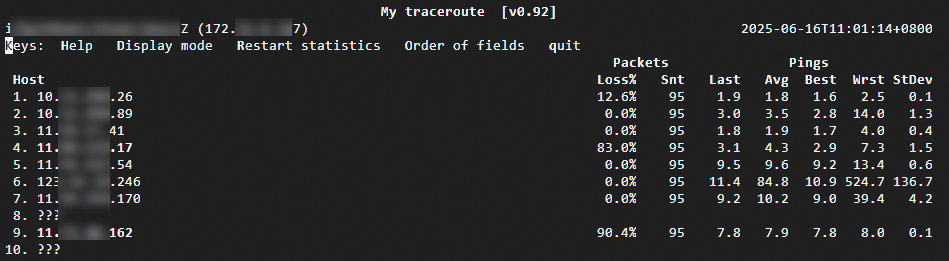
Node interruption
Packets stop receiving responses after passing through a hop. The Loss%, Last, Avg, and Best fields show no statistics.
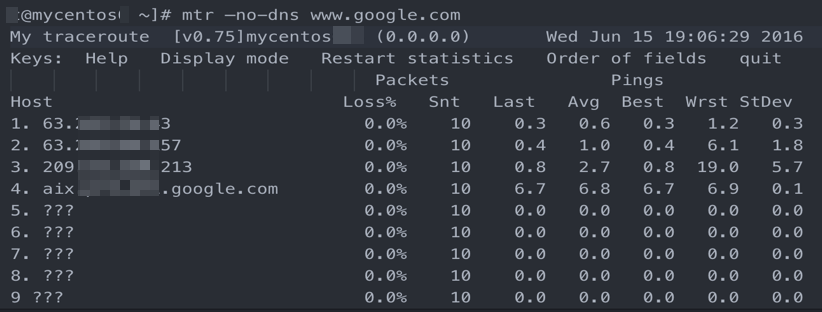
In the example, no responses are returned after hop 4. This typically indicates the node is down. Run a reverse path test to confirm, then contact the carrier responsible for that node.