Diagnose packet loss and latency issues with MTR by tracing each hop and analyzing link quality metrics.
Test process
The following figure shows the typical link test process.

-
Visit a website such as IP Address Query - IPLark to obtain the public IP address of your on-premises network.
-
The destination server refers to the domain name or public IP address of the target service.
Tool overview
MTR combines ping and traceroute. Unlike traceroute, which traces a link only once, mtr continuously probes each hop and collects statistics, reducing the impact of transient fluctuations and producing more accurate mtr results.
On Linux, use mtr by installing the mtr package. On Windows, use WinMTR.
mtr (Linux)
Installation
CentOS 6/7/8
Ubuntu/Debian
Usage
Command format
mtr uses the following format. hostname is the service domain name, and ip is the public IP address.
mtr [options] hostname/ipParameters
The following table lists common parameters. Run man mtr for the full list.
|
Optional parameter |
Description |
|
|
Displays output in report mode. |
|
|
Lists each link trace result separately. |
|
|
Specifies the ping packet size. |
|
|
Disables DNS resolution for IP addresses. |
|
|
Sets the source IP address for outgoing packets. Note
Use this when the host has multiple IP addresses. |
|
-4 |
Uses IPv4 only. |
|
-6 |
Uses IPv6 only. |
By default, mtr enters interactive mode. Press ? or h to display the help menu for controlling mtr and switching display views.
Usage example
Diagnose the network with IPv4.
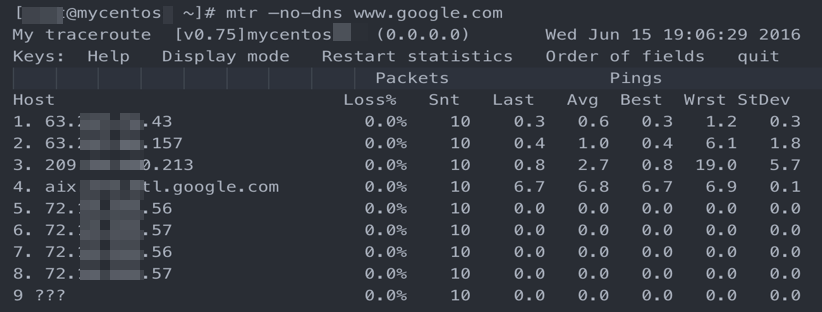
sudo mtr -4 www.aliyun.comSample output
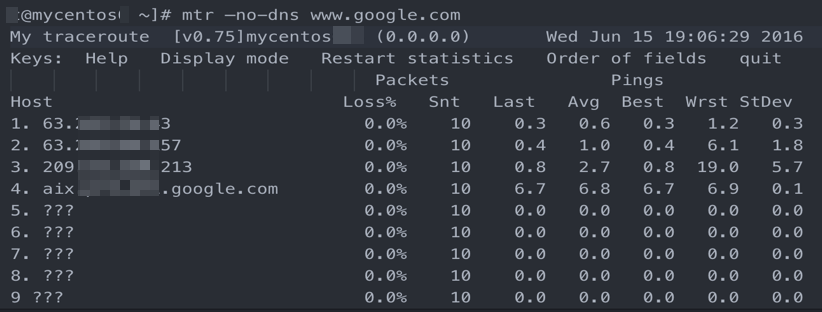
The following output is returned after running mtr <Destination IP address>:
The following table describes the default output fields.
|
Parameter |
Description |
|
Host |
The node IP address or domain name. Press |
|
Loss% |
Packet loss rate of the node. |
|
Snt |
Number of packets sent. Default: 10. Use |
|
Last |
Latency of the last probe. |
|
Avg |
Average latency of all probes. |
|
Best |
Minimum latency of all probes. |
|
Wrst |
Maximum latency of all probes. |
|
StDev |
Standard deviation. A higher value indicates less stable latency. |
WinMTR (Windows)
Installation
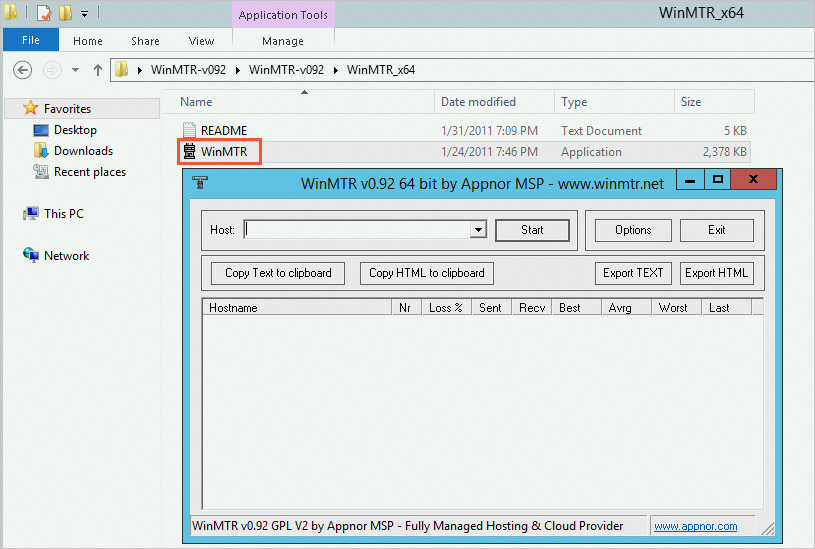
WinMTR requires no installation. Download the package, decompress it, and run the executable.
-
Go to the official WinMTR website to download WinMTR.
-
Decompress the package and double-click WinMTR to run it.
Usage
-
In the Host field, enter the domain name or IP address of the destination server.
ImportantThe domain name or IP address of the destination server cannot contain spaces.
The following table describes additional features and parameters.
Feature or parameter
Description
Copy Text to clipboard
Copies test results to the clipboard in text format.
Copy HTML to clipboard
Copies test results to the clipboard in HTML format.
Export TEXT
Exports test results to a file in text format.
Export HTML
Exports test results to a file in HTML format.
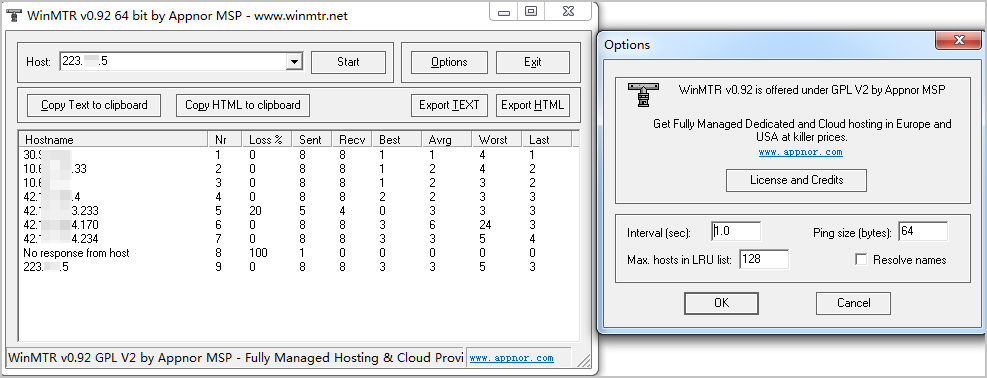
Options
Optional parameters:
-
Interval (sec): Probe interval. Default: 1 second.
-
Ping size (bytes): Ping packet size. Default: 64 bytes.
-
Max. hosts in LRU list: Maximum hosts in the LRU list. Default: 128.
-
Resolve names: Resolves IP addresses to domain names via reverse lookup.
-
-
Click Start.
Start changes to Stop, and WinMTR displays the results.
-
After sufficient data is collected, click Stop.
Sample output
The following output is returned when testing a destination server domain name:
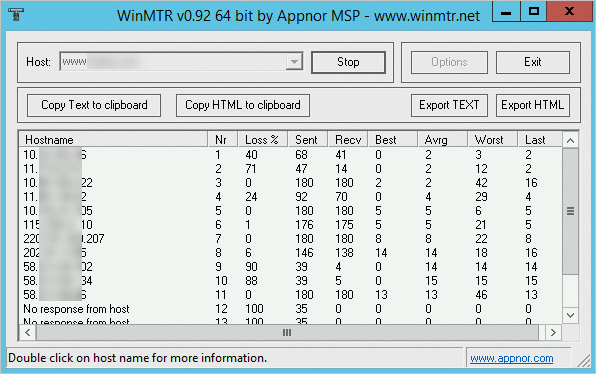
The following table describes the default output fields:
|
Parameter |
Description |
|
Hostname |
The node IP address or domain name. |
|
Nr |
The sequential node number. |
|
Loss% |
Packet loss rate of the node. |
|
Sent |
Number of packets sent. |
|
Recv |
Number of packets received. |
|
Best |
Minimum latency of the node. |
|
Avg |
Average latency of the node. |
|
Worst |
Maximum latency of the node. |
|
Last |
Latency of the most recent probe. |
|
StDev |
Standard deviation. A higher value indicates less stable latency. |
Result analysis guide
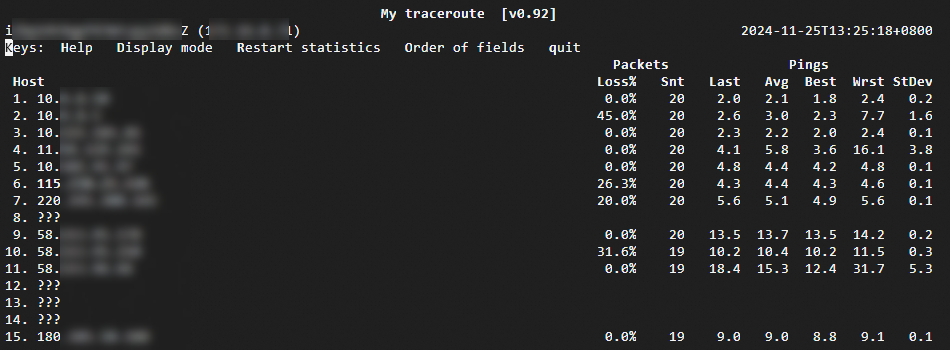
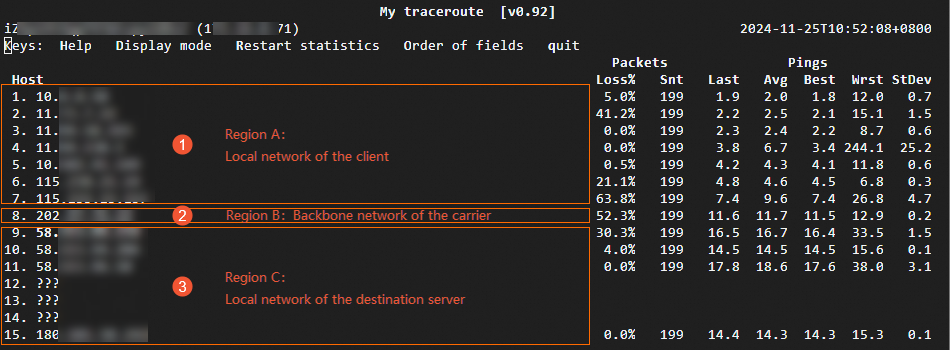
The following analysis uses mtr results as the example because mtr provides higher accuracy. The sample results are shown below.
Network areas
The link from the client to the destination server typically passes through the following network areas.
-
Client's on-premises network
Includes the LAN and the local ISP network, such as Area A in the figure. Exceptions fall into two types.
-
If the exception is on a node within the client's on-premises network, troubleshoot the on-premises network.
-
If the exception is on an ISP node, report the issue to the local Internet Service Provider (ISP).
-
-
Carrier network
The ISP backbone network, such as Area B in the figure. If an exception occurs here, query the abnormal node's IP address to identify its ISP. Report the issue to the ISP directly or through Alibaba Cloud technical support.
-
Destination server's on-premises network
The destination host provider's network, such as Area C in the figure. If an exception occurs here, report the issue to the destination host's network provider.
If link load balancing is enabled for part of the intermediate link, mtr numbers and probes only the first and last nodes. Intermediate nodes display only IP addresses or domain names.
Metric analysis
Analyze link connectivity and performance by examining Loss%, Avg, StDev, and latency together.
Loss% (packet loss rate)
If any node shows a non-zero Loss%, a problem may exist at that hop. Packet loss is typically caused by one of the following:
-
The ISP has rate-limited ICMP on the node for security or performance reasons.
-
The node is faulty. Check the packet loss status of the abnormal node and subsequent nodes:
-
If subsequent nodes show no packet loss, the loss is typically caused by ISP rate limiting. You can ignore it, as shown at the second hop in the figure.
-
If subsequent nodes also show packet loss, the node has a network exception, as shown at the sixth hop in the figure.
-
If subsequent nodes include both nodes with and without packet loss, both rate limiting and a network exception may be present. When packet loss occurs continuously across multiple consecutive hops with varying rates, use the rate at the last few hops as the reference. In the figure, hops 6–9 show packet loss, so the final packet loss rate is 30.3% at hop 9.
-
Avg (average value) and StDev (standard deviation)
Link jitter and other factors can cause wide variation between the Best and Wrst values. Avg averages all probes since the test began, so it better reflects overall network quality. StDev indicates how spread out latency values are — a high StDev means Avg may not accurately represent actual conditions. For example, if some packets have 25 ms latency while others have 350 ms, the average may appear normal despite poor actual performance.
Recommended analysis approach:
-
If StDev is high, check
BestandWrstto determine whether an exception exists. -
If StDev is low, use Avg to assess the node.
NoteWhether StDev is high or low depends on context. For example, an StDev of 25 ms is a large drift when Avg is 30 ms, but a small drift when Avg is 325 ms.
Latency
-
Latency spike
If latency spikes sharply after a certain hop, a network exception likely exists there. In the figure, latency increases sharply after the sixth hop. However, since data still reaches the destination, the high latency might originate on the return path. Analyze this together with a reverse link test.
-
Latency increase due to ICMP rate limiting
ICMP rate limiting can also cause a latency spike at a node, but subsequent nodes typically return to normal. In the figure, the ninth hop shows 30% packet loss and high latency, but the next hops return to normal — indicating the spike is caused by rate limiting.
Sample analysis
Based on the sample results and the analysis guide above:
-
Packet loss occurs at hops 2, 6, 7, 8, and 9, but not at hops 3, 4, 5, 10, 11, and 15. If network requests function normally, the packet loss is likely caused by ICMP rate limiting.
-
The
Wrstat the fourth hop is high, butAvgis not. This may be caused by a transient fluctuation during one probe. -
Average latency across all nodes ranges from 1.8 ms to 17.6 ms, indicating low overall latency.
The network link in this example is normal. If fluctuations occur in your actual environment, analyze them together with the reverse link test results.
Network analysis is flexible. The preceding sections describe common metric analysis methods. In practice, make a comprehensive assessment based on your specific situation. If a one-way test is inconclusive, combine it with a reverse link test for deeper analysis.
Common link exceptions
The following examples use mtr on Linux. Actual results may vary by operating system and tool.
Improper network configuration on the destination host
As shown below, 100% packet loss occurs at the destination. This may appear as though packets did not arrive. However, security policies on the destination server, such as a firewall or iptables, likely blocked ICMP responses. Check the security policy configuration of the destination server.
ICMP rate limiting
As shown below, the destination shows a high packet loss rate. Security policies such as a firewall, iptables, or ISP rate limiting likely blocked ICMP responses. Check the destination server's security policy or perform a reverse MTR test for comprehensive analysis.
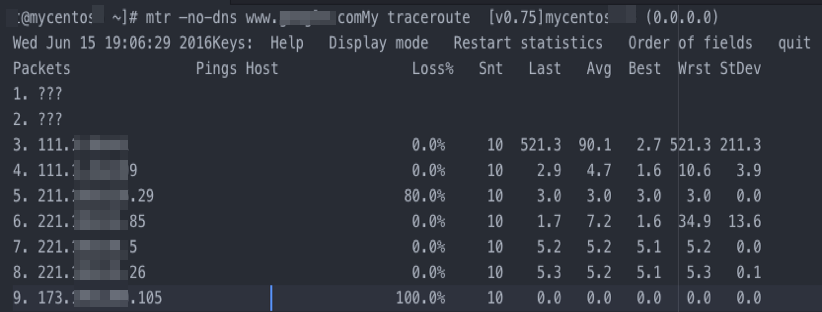
Routing loop
As shown below, packets enter a loop after the fifth hop and cannot reach the destination. This is typically caused by an abnormal routing configuration on an ISP node. Contact the ISP that owns the node.
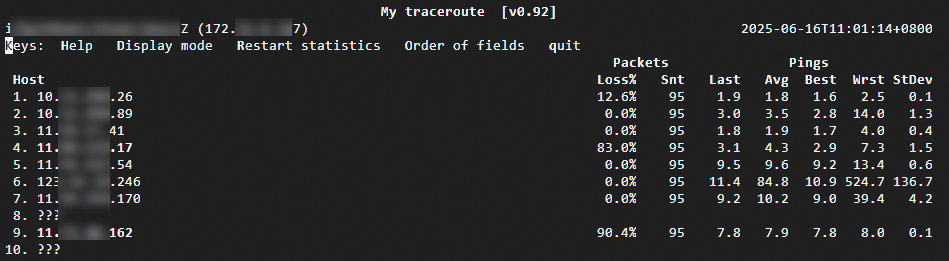
Link interruption
As shown below, no feedback is received after the fourth hop, and Loss%, Last, Avg, and Best show no statistics. This is typically caused by a link interruption at that node. Use a reverse link test for confirmation. Contact the ISP that owns the node.