This topic explains how to use tools such as Task Manager, Resource Monitor, and Wireshark to troubleshoot and resolve high bandwidth utilization on a Windows instance.
Symptoms
High bandwidth utilization on a Windows instance can cause the following symptoms:
-
Services have long response times or time out.
-
Network monitoring metrics in the ECS console show high bandwidth utilization, which is typically defined as over 80%.
-
You receive an alert that the network bandwidth utilization has exceeded the specified threshold.
Possible causes
Possible causes include:
-
Frequent access from normal services consumes high bandwidth.
-
Malicious activities, such as application-layer CC attacks, DDoS attacks, viruses, or trojans, generate high network traffic.
NoteIn some cases, third-party malware may disguise itself by using the names of operating system processes such as
svchost.exeortcpsvcs.exe, causing high bandwidth utilization for these processes. -
Built-in Windows services, such as the Windows Update service, consume high network traffic.
Procedure
View network metrics in Resource Monitor
Windows provides several tools, including Task Manager, Resource Monitor, Performance Monitor, and Process Explorer, to identify the cause of high bandwidth utilization. For more detailed analysis, you can use Wireshark to capture network packets.
For Windows Server 2008 and later, the built-in Resource Monitor is typically used to monitor bandwidth.
-
On the taskbar, click Search, enter Resource Monitor, and then press the Enter key.
-
In the Resource Monitor window, identify the processes that are consuming excessive bandwidth.
Select the Network tab. In the Processes with Network Activity panel, check the Send (B/sec), Receive (B/sec), and Total (B/sec) columns to identify any processes that are consuming an abnormal amount of bandwidth.
NoteTo view the details of a process, use Task Manager. In the Processes tab of Task Manager, find the abnormal process that you identified in Resource Monitor. Right-click the process name and select Properties, Go to details, or Open file location. Use this information to determine whether the process is a malicious program.
(Optional) Use TCPView for network connections
If Resource Monitor shows no processes with high bandwidth utilization, yet overall utilization remains high, the cause is likely external services accessing your instance. Use Microsoft's official TCPView tool for further analysis. TCPView provides a detailed list of all TCP and UDP network connections on the system, including local and remote addresses and the status of TCP connections.
-
Download and decompress the TCPView tool.
Download the TCPView tool from the official Microsoft website, and then decompress the package.
-
Double-click the TCPView tool to open it and view network connection details.
In TCPView, use the Sent Packets, Recv Packets, Sent Bytes, and Recv Bytes columns to view packet and byte statistics for each connection.
This allows you to see which remote addresses, such as 123.xxx.xxx.74, are transferring data to the instance and consuming the most network bandwidth resources.
(Optional) Use Wireshark to analyze traffic
For in-depth analysis of traffic data, you can use Wireshark to capture and analyze network packets.
-
Install and start Wireshark.
Download the installation package from the Wireshark official website and install it.
-
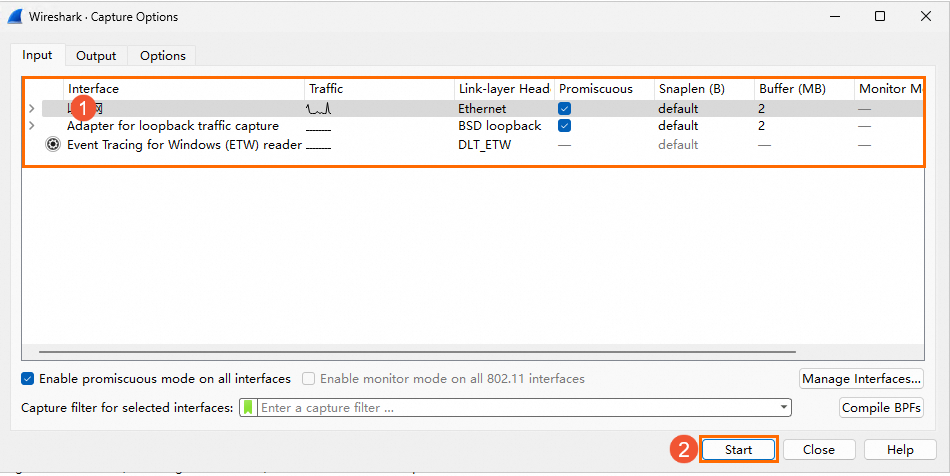
Choose Capture> Options.
-
On the Wireshark Capture Options page, select a network interface based on the interface name or IP address, and click Start.
-
In the Wireshark toolbar, choose Statistics>Conversations.
-
The Conversations page displays all network communications. Wireshark provides traffic details at the data link, IP, and TCP layers, including traffic for both endpoints. Capturing packets over time helps identify which connections and ports consume the most traffic.
The conversation table includes columns such as Address A, Address B, Packets, Bytes, Rel Start, Duration, bps A→B, and bps A←B. You can use the Follow Stream and Graph buttons at the bottom to further trace and analyze the traffic trend of a selected conversation.
You can capture packets to further analyze network data. For more information, see Use the Wireshark tool in Windows instances.
Resolve high bandwidth utilization
The following table lists common causes of high network bandwidth utilization and their solutions.
|
Symptoms |
Cause |
Solution |
|
An abnormal user program or process consumes excessive network resources for an extended period, or an unauthorized IP address maliciously accesses the service, resulting in a high network load. |
The program or process is abnormal and consumes excessive network resources at runtime. |
|
|
A normal user program or process consumes excessive network resources for an extended period, or a specific IP address accesses the service frequently, resulting in a high network load. |
The program is a normal business program or process that consumes excessive network resources during runtime. |
High network traffic and CPU usage can occur due to frequent business access or native Windows services (such as updates). If your instance reaches a network performance bottleneck, consider the following strategies:
|
|
A single business program or process occasionally causes a brief and infrequent spike in network resource usage. |
The business application requires optimization to handle high network consumption triggered by specific scenarios (such as large file uploads or downloads). |
Optimize your business application. Consider optimizing your code and adjusting application configuration parameters, such as the number of connections, cache settings, and web and database configurations. |
|
No single program or process consumes excessive network resources, but the overall network load is high. |
The network resources required for the services on the instance exceed the instance bandwidth. |
If the instance hits a network performance bottleneck, you can upgrade the bandwidth. For more information, see Modify the bandwidth configuration of an instance. Note
If the maximum instance bandwidth is still insufficient for your business needs, consider separating your applications by hosting different services on separate servers. For example, you can use RDS to host your database service to reduce resource consumption and internal calls on the ECS instance. |
References
-
For information about how to troubleshoot and resolve high network bandwidth utilization on Linux systems, see Troubleshoot and resolve high network bandwidth utilization on a Linux instance.
-
If you need to collect network metrics for anomaly analysis, you can use the atop tool. For more information, see Use the atop tool to monitor Linux system metrics.