Jindo AuditLog records every file operation—create, delete, or rename—performed by clients on JindoFS namespaces in block storage mode or cache mode. Use it to audit access patterns, detect abnormal requests, and track errors.
Prerequisites
Before you begin, ensure that you have:
An E-MapReduce (EMR) cluster. For more information, see Create a cluster.
An Object Storage Service (OSS) bucket to store audit log files. For more information, see Create buckets.
How it works
AuditLog captures each file operation performed by clients on JindoFS namespaces. Each log entry records who made the request, the client IP address, whether the operation was allowed, and the paths involved.
Log files are stored in OSS. Each log file can be up to 5 GB. Use OSS lifecycle management to set a retention period and automatically delete old log files.
To query log files, use the jindo sql command. It is built on Spark SQL and provides three built-in tables:
| Table | Contents | Notes |
|---|---|---|
audit_log_source | Raw audit log data | Partitioned |
audit_log | Cleansed audit log data | — |
fs_image | fsimage log data | Partitioned |
Audit log fields
The following table describes the fields in each log entry for namespaces in block storage mode.
| Field | Description | Example |
|---|---|---|
Time | Timestamp of the operation. Format: yyyy-MM-dd hh:mm:ss.SSS. | 2020-07-09 18:29:24.689 |
allowed | Whether the operation was permitted. | true |
ugi | The user who performed the operation, including the authentication method. | hadoop (auth:SIMPLE) |
ip | The client IP address. | 127.0.0.1 |
ns | The namespace name in block storage mode. | test-block |
cmd | The operation command. | CreateFileletRequest |
src | The source path. | jfs://test-block/test/test.snappy.parquet |
dst | The destination path. Empty if not applicable. | null |
perm | The file permissions for the operation. | ::rwxrwxr-x |
Example log entry:
2020-07-09 18:29:24.689 allowed=true ugi=hadoop (auth:SIMPLE) ip=127.0.0.1 ns=test-block cmd=CreateFileletRequest src=jfs://test-block/test/test.snappy.parquet dst=null perm=::rwxrwxr-xEnable and configure audit log
Step 1: Enable audit log in SmartData
Log on to the Alibaba Cloud EMR console.
In the top navigation bar, select the region where your cluster resides. Select the resource group as required. By default, all resources of the account appear.
Click the Cluster Management tab.
On the Cluster Management page, find the target cluster and click Details in the Actions column.
In the left-side navigation pane, click Cluster Service and then SmartData.
Click the Configure tab.
In the Service Configuration section, click the namespace tab.
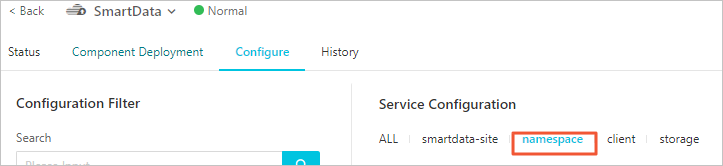
Click Custom Configuration in the upper-right corner.
In the Add Configuration Item dialog box, configure the following parameters.
Parameter Description Required jfs.namespaces.{ns}.auditlog.enableWhether to enable audit log for the namespace. Set to trueto enable,falseto disable.Yes namespace.sysinfo.oss.uriThe OSS bucket where log files are stored. Format: oss://<yourbucket>/auditLog. Replace<yourbucket>with your bucket name.Yes namespace.sysinfo.oss.access.keyThe AccessKey ID used to access the OSS bucket. No namespace.sysinfo.oss.access.secretThe AccessKey secret used to access the OSS bucket. No namespace.sysinfo.oss.endpointThe endpoint of the OSS bucket. No In the upper-right corner of the Service Configuration section, click Deploy Client Configuration.
In the Cluster Activities dialog box, specify a description and click OK.
In the confirmation message, click OK.
Step 2: Restart Jindo Namespace Service
In the upper-right corner, choose Actions > Restart Jindo Namespace Service.
In the Cluster Activities dialog box, specify a description and click OK.
In the confirmation message, click OK.
Step 3: Set a retention period for log files
OSS lifecycle management automatically deletes log files after a specified number of days. Each log file can be up to 5 GB.
Log on to the OSS console.
In the left-side navigation pane, click Buckets. On the Buckets page, click the name of your bucket.
In the left-side navigation pane, choose Basic Settings > Lifecycle. In the Lifecycle section, click Configure.
Click Create Rule and configure the parameters in the panel.
Click OK.
Analyze log files
Use the jindo sql command to run SQL queries against audit log data. The command uses Spark SQL syntax and provides direct access to three built-in tables: audit_log, audit_log_source, and fs_image.
Useful commands
| Command | Description |
|---|---|
jindo sql --help | Show available parameters, including -f (run a SQL file) and -i (run an initialization script on startup). |
show partitions <table_name> | List all partitions of a table. |
desc formatted <table_name> | View the table schema. |
Tune startup resources
jindo sql starts with minimal default resources. To handle larger datasets, increase resources using the JINDO_SPARK_OPTS environment variable:
export JINDO_SPARK_OPTS="--conf spark.driver.memory=4G --conf spark.executor.instances=20 --conf spark.executor.cores=5 --conf spark.executor.memory=20G"Example queries
List all available tables:
show tables;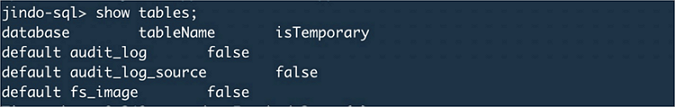
List all partitions in the audit_log_source table:
show partitions audit_log_source;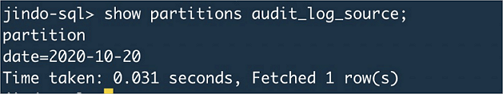
Query raw audit log data:
select * from audit_log_source limit 10;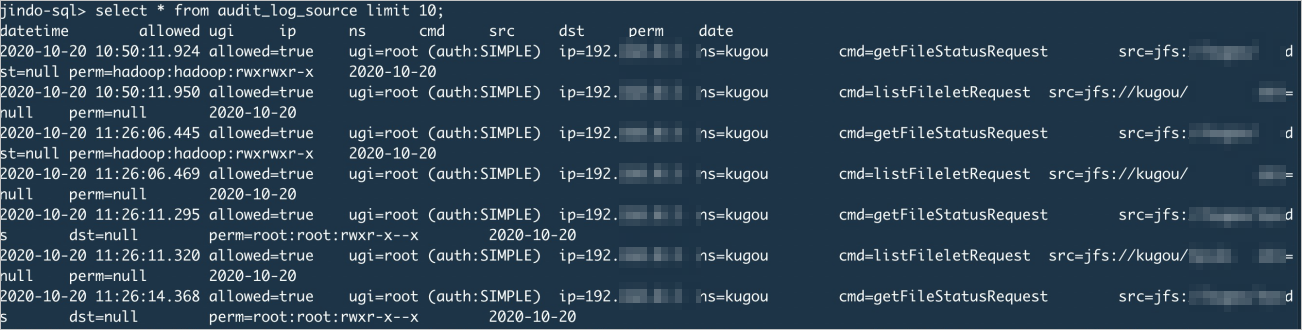
Query cleansed audit log data:
select * from audit_log limit 10;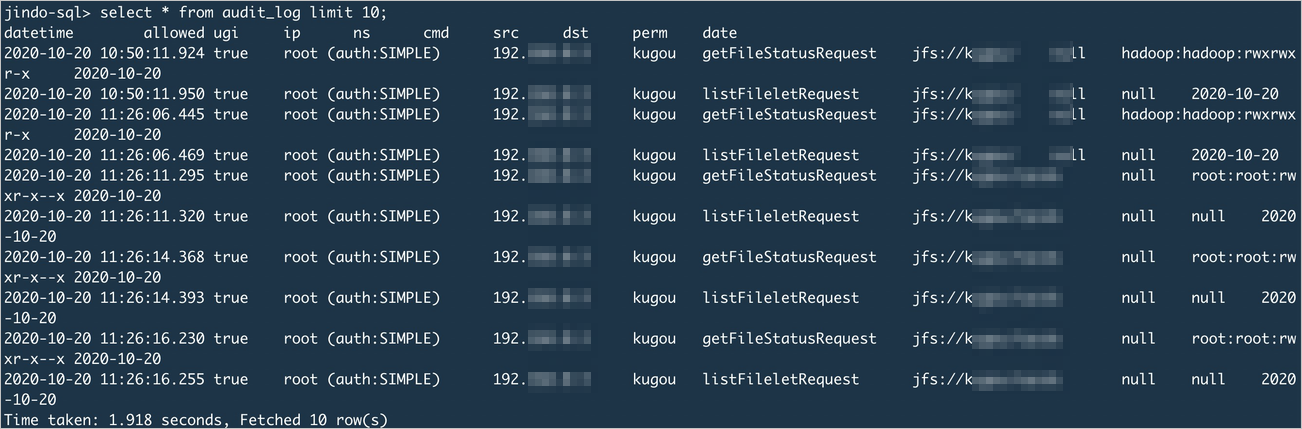
Collect statistics on command usage frequency for a specific date:
