This topic provides a quick start for viewing the performance and result of a job in the Elastic High Performance Computing (E-HPC) console.
Prerequisites
A job is created and completed. For more information, see Create and submit a job.
Procedure
Log on to the E-HPC console.
In the top navigation bar, select a region.
In the left-side navigation pane, choose .
Click Details on the right side of the Job page to view the details of the job.
View the performance of the job.
In the left-side navigation pane, choose E-HPC Tune.
On the ClusterView page, find gromacs-test, and click Node in the Operation column.
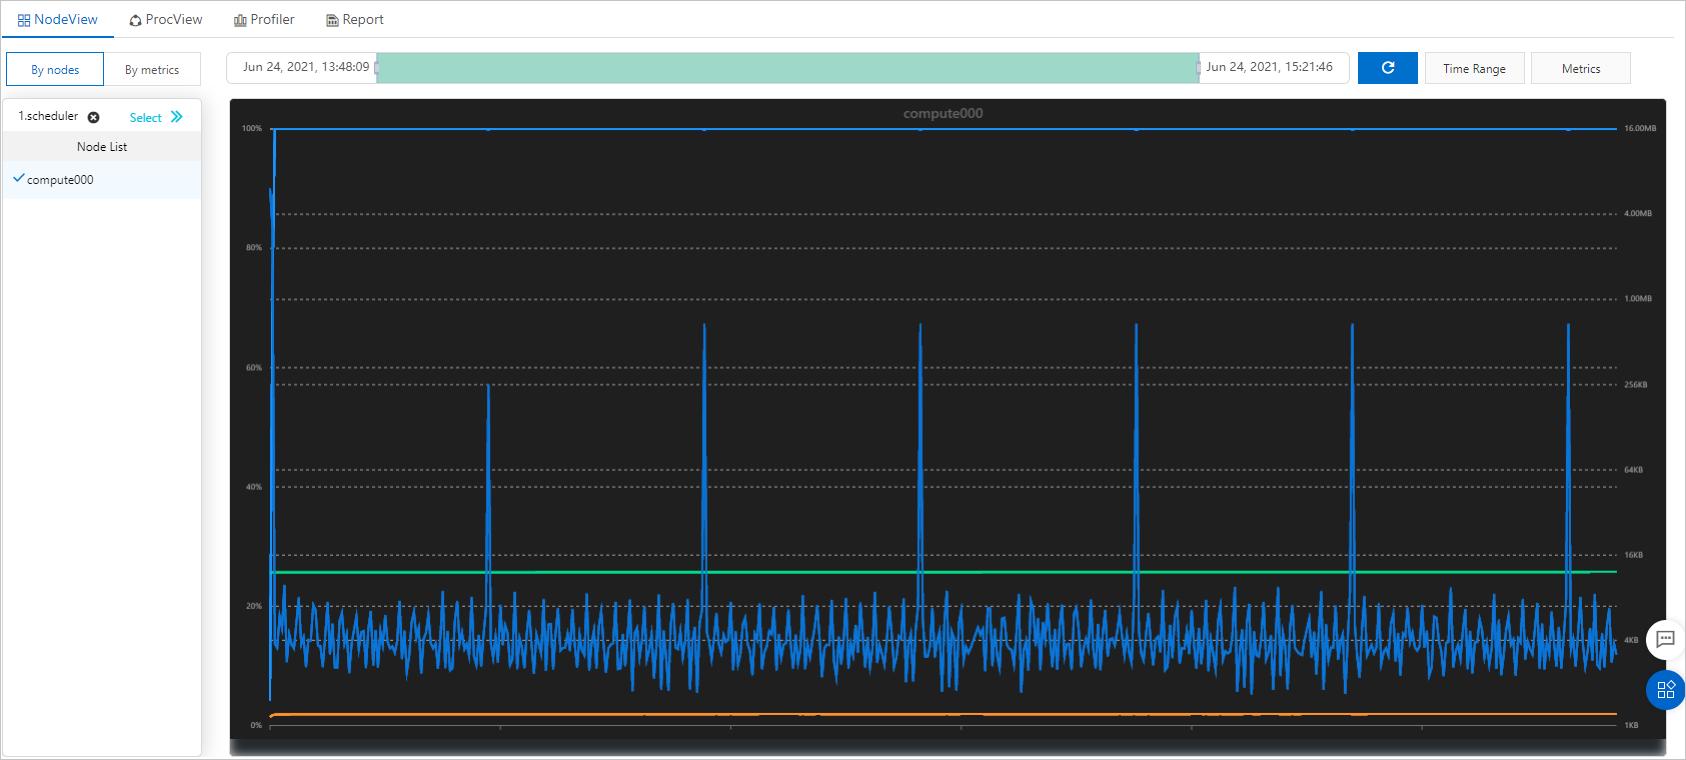
Select the job and the node. Complete the metric configuration to view the node performance.
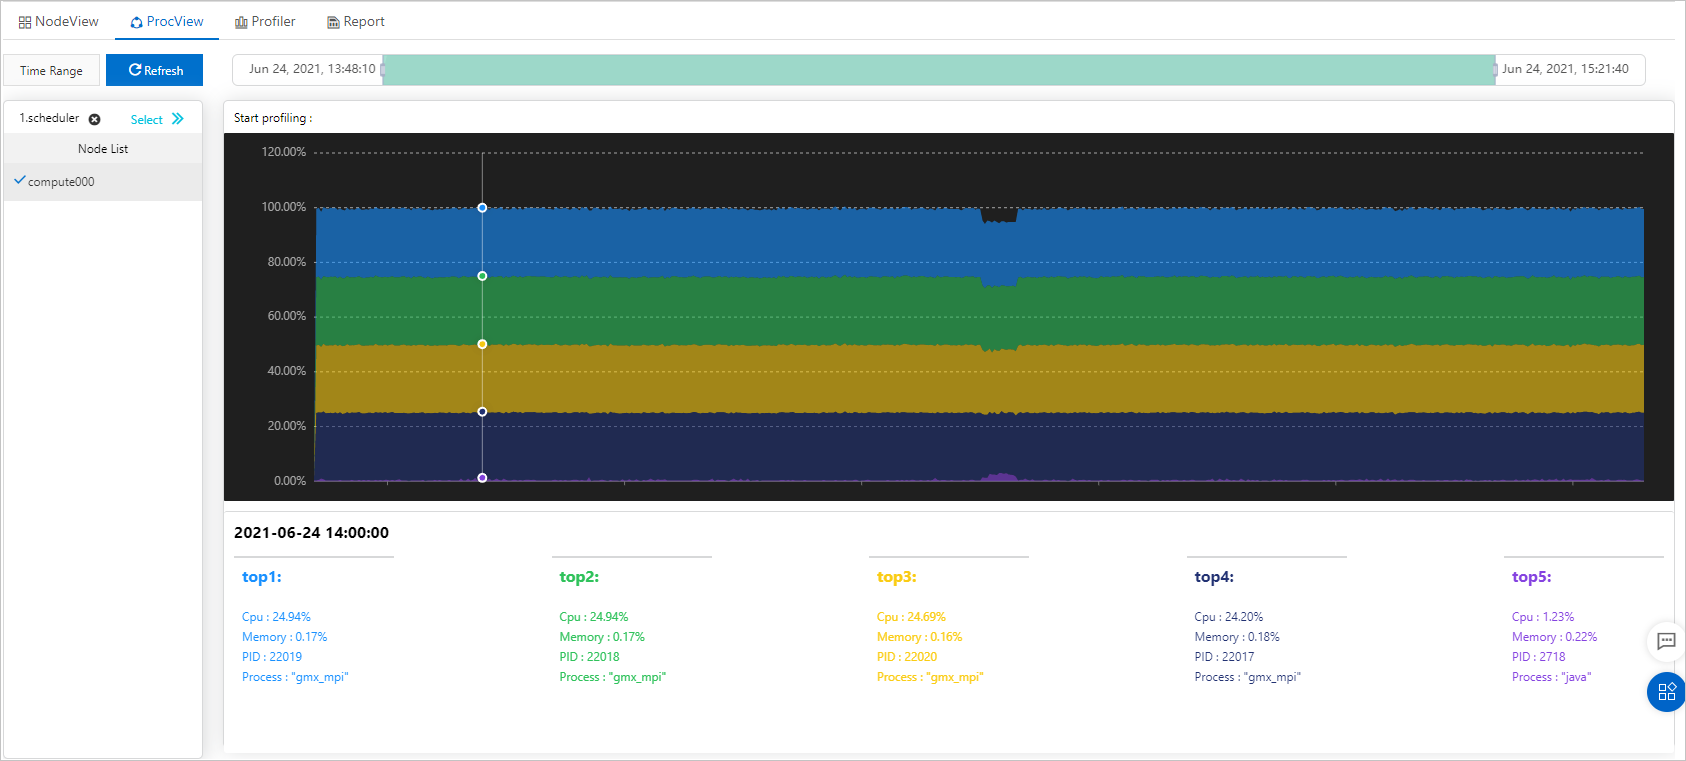
Click the ProcView tab to view the details of top five processes that have the highest CPU utilization at the current point in time.
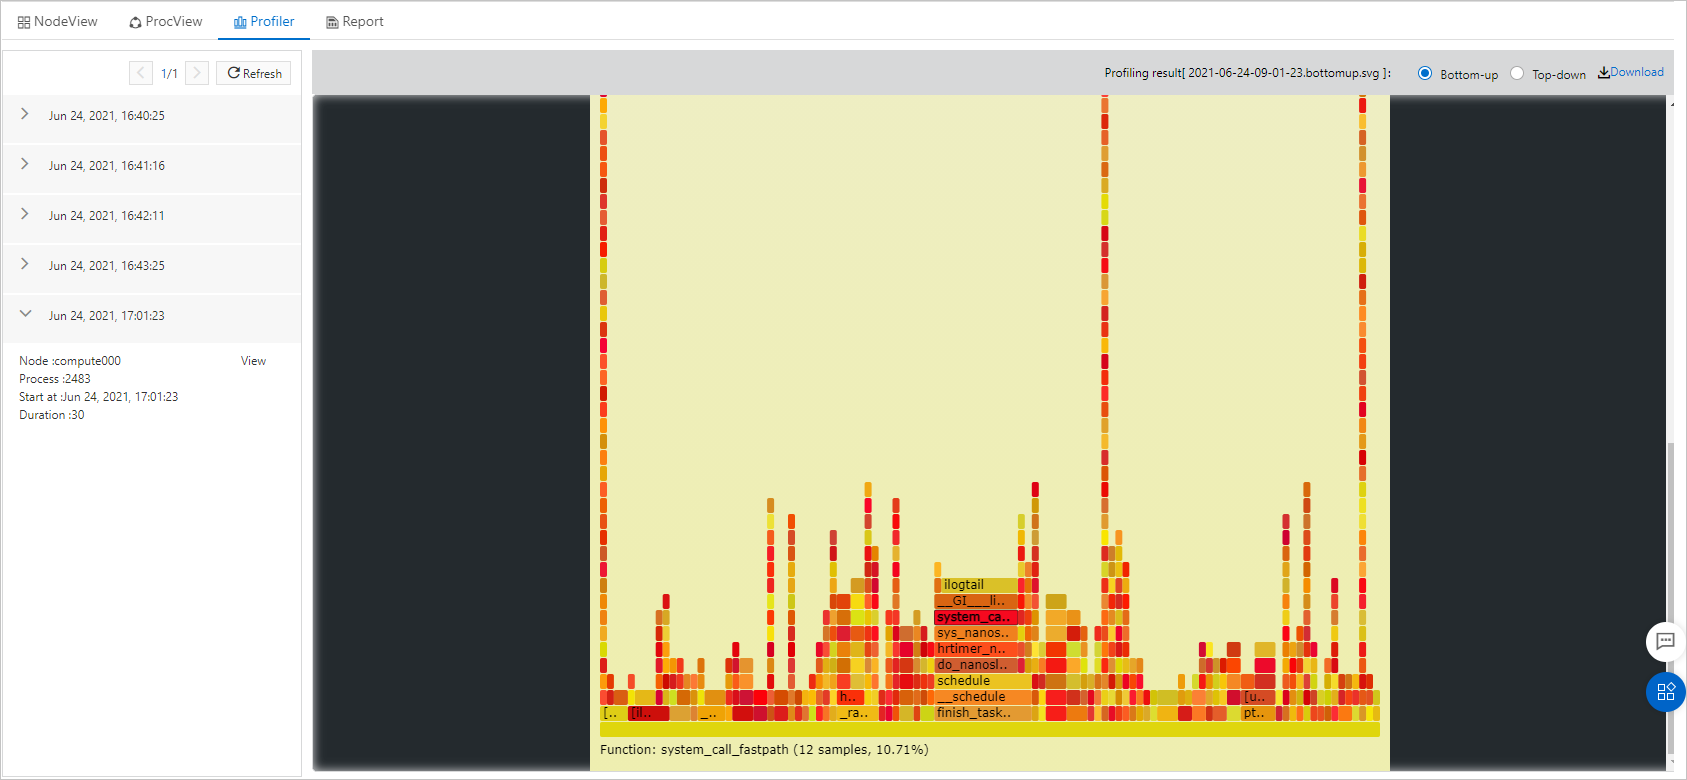
Click the node process that you want to profile. Set a duration and frequency for the profiling, start real-time profiling for the GROMACS job, and then obtain the flame graph of hot functions.
Use VNC to view the result of the job.
On the Cluster page, find gromacs-test. Choose More > VNC.
In the cloud desktop of E-HPC, click Connect.
In the Input Password dialog box, enter the password and click OK.
In the Virtualization Service dialog box of the cloud desktop, choose Application > System Tools > Terminal.
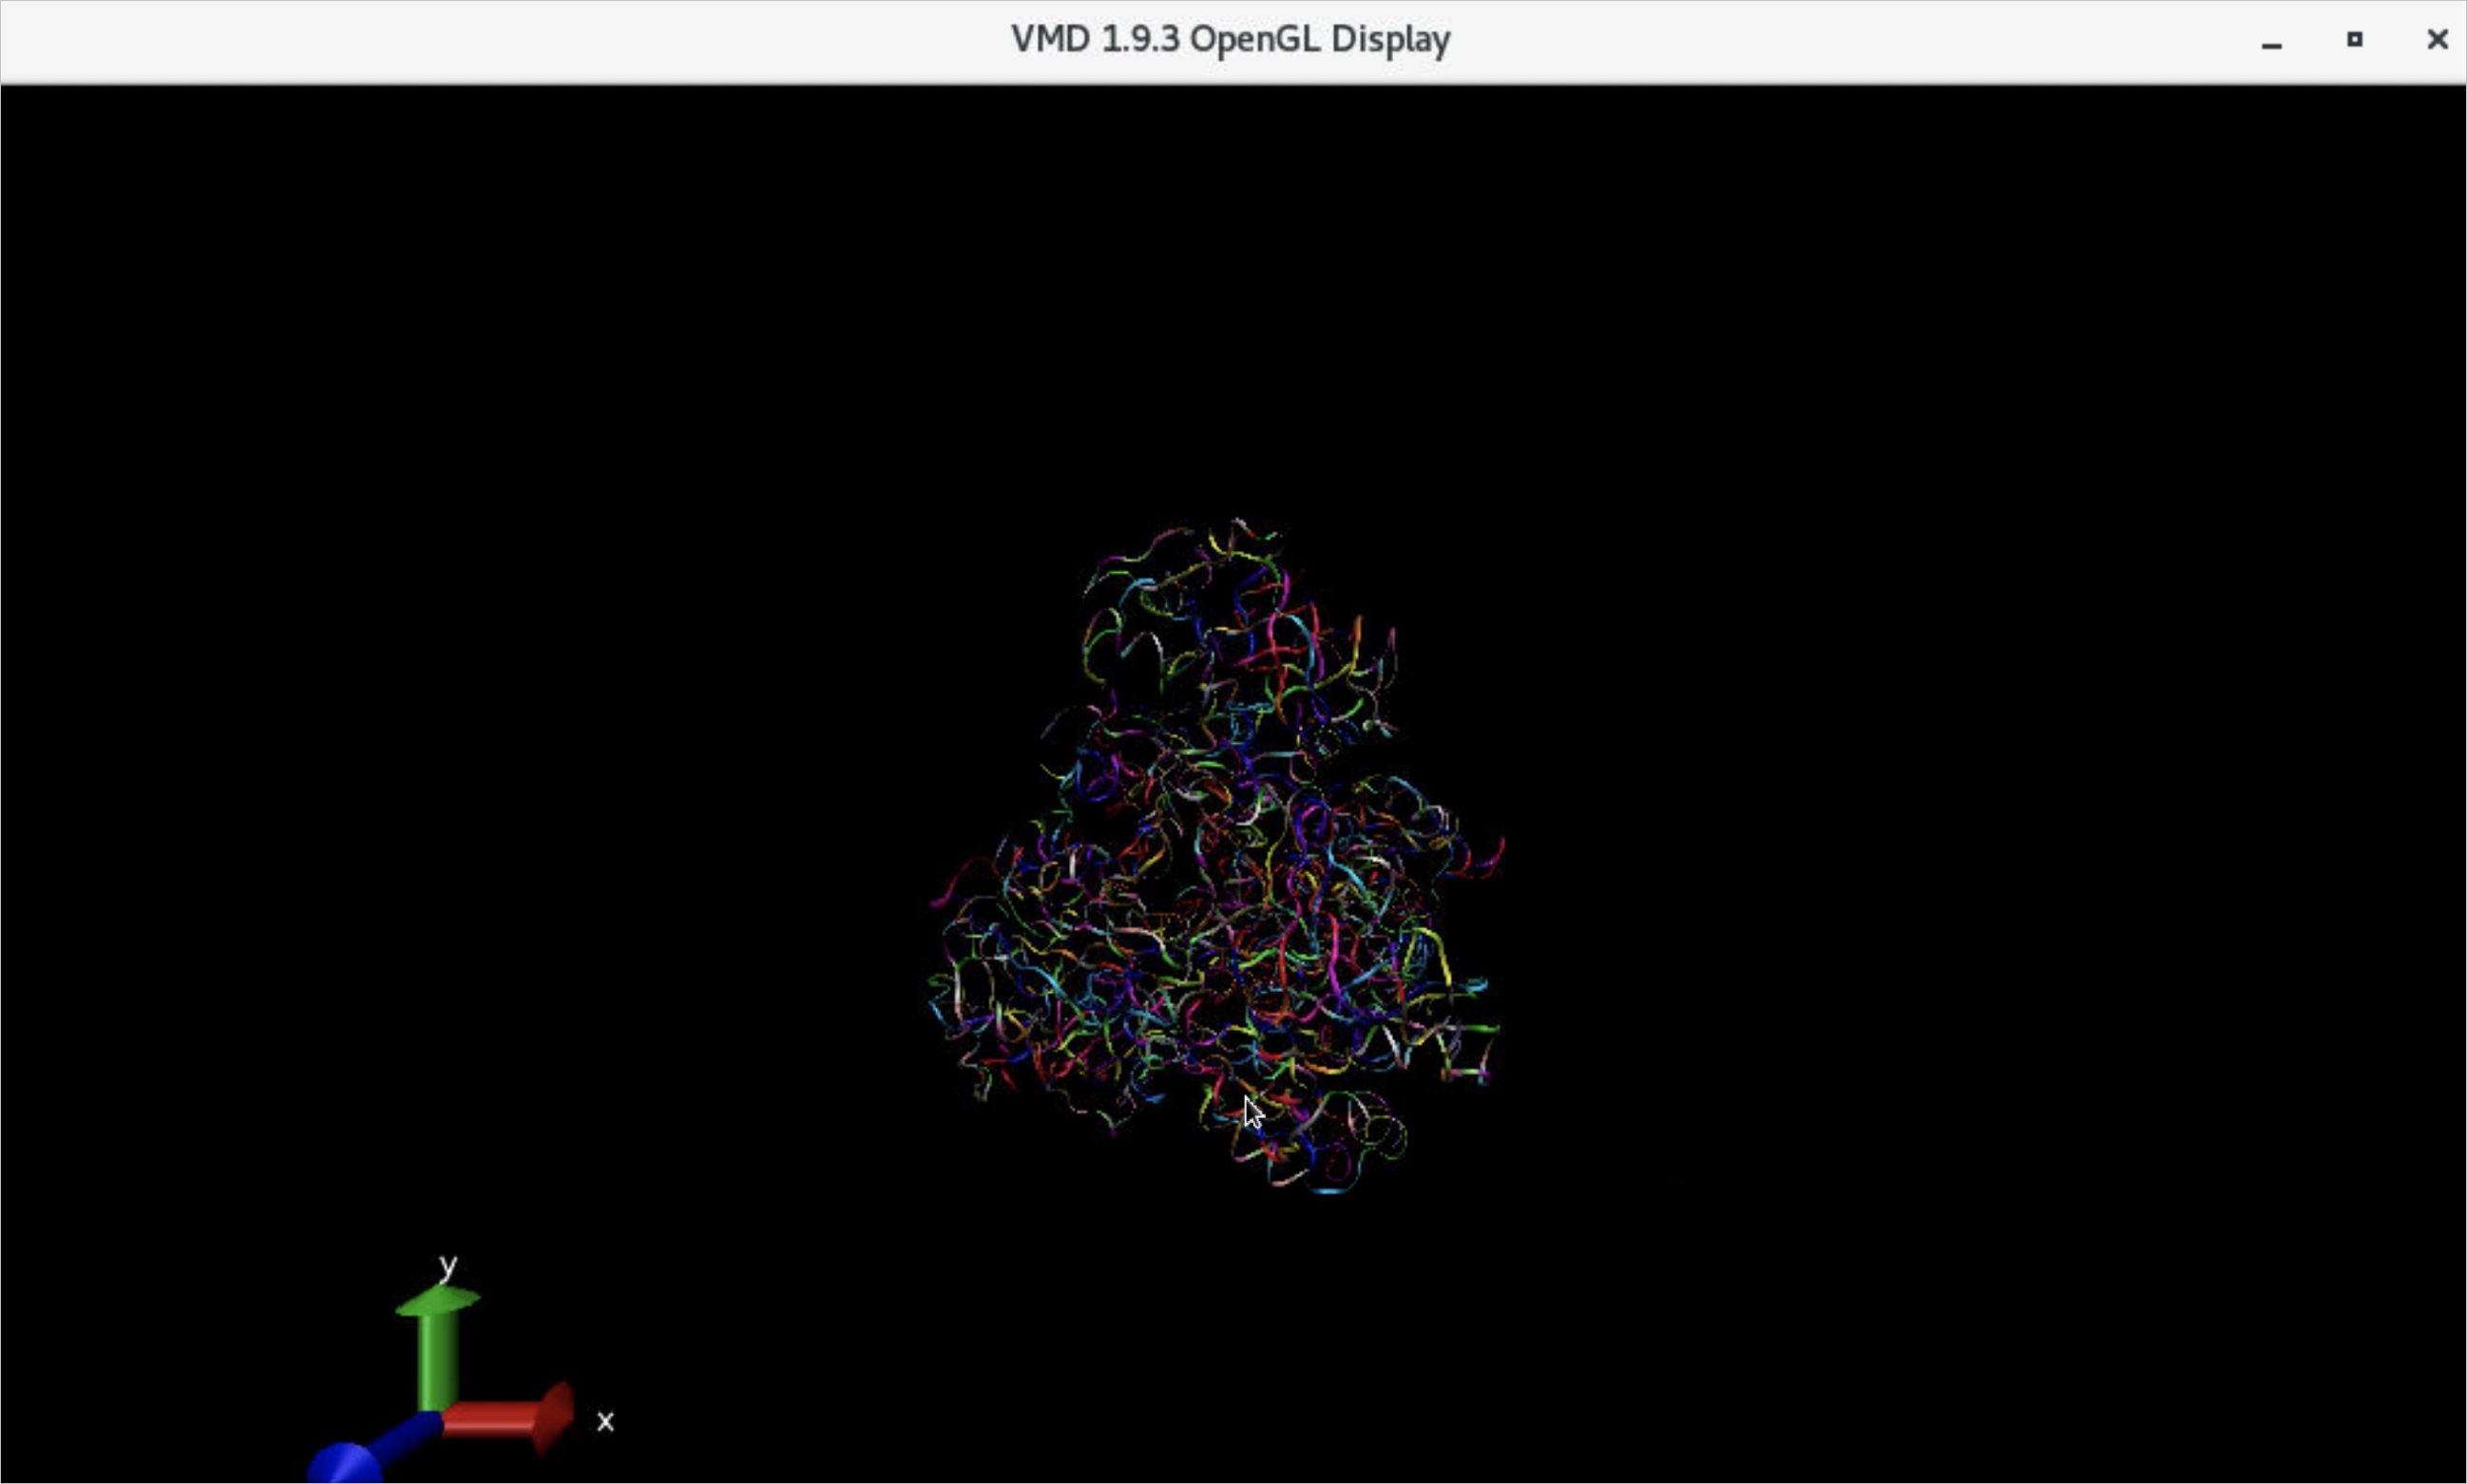
Run
/opt/vmd/1.9.3/vmdin the Terminal dialog box of the cloud desktop to open Visual Molecular Dynamics (VMD).Load files of molecular structures and trajectories into VMD to view the simulation effect.