Monitor ECS instance health through the ECS console or CloudMonitor, with real-time metrics and alerts for vCPU, network, and disk I/O.
Background
ECS instances can be monitored in the ECS or CloudMonitor console.
-
ECS console: monitors vCPU utilization, network traffic, and disk I/O.
-
CloudMonitor console: provides more fine-grained resource monitoring.
Metrics
ECS instance monitoring metrics:
-
vCPU utilization: the percentage of allocated compute units in use. A higher percentage indicates a higher vCPU load. You can view vCPU data in the ECS or CloudMonitor console, by calling API operations, or by connecting to the instance directly.
To view vCPU utilization after connecting to the instance:
-
Windows instance: Open Task Manager and sort processes by vCPU utilization to identify high-consumption processes.
-
Linux instance: Run top and press Shift+P to sort processes by vCPU utilization.
-
-
Network traffic metrics: inbound and outbound bandwidth usage of the instance in Kbit/s.
ECS monitors public bandwidth. CloudMonitor monitors both public and internal bandwidth. For example, if 1 Mbit/s outbound public bandwidth is allocated and usage reaches 1,024 Kbit/s, the bandwidth is fully utilized.
View monitoring data in the ECS console
-
Go to ECS console - Instances.
In the upper-left corner of the page, select a region and resource group.

-
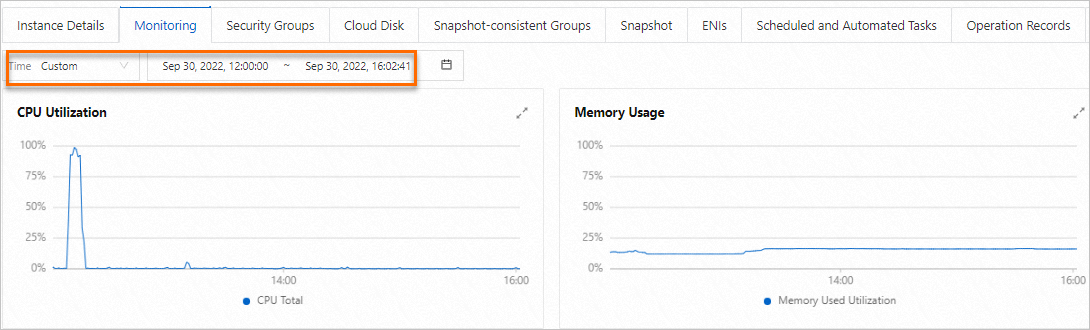
Find the target instance and click its ID. On the Instance Details page, click the Monitoring tab.
-
Specify a time range to view metrics such as vCPU utilization and memory usage.
Data granularity varies by time range — shorter ranges yield higher resolution. For example, a 1-hour range has a finer aggregation interval than a 6-hour range, producing different average values.
 Note
NoteYou can also query monitoring data by calling API operations such as DescribeInstanceMonitorData, DescribeDiskMonitorData, and DescribeEniMonitorData.
The monitoring data available in the ECS console depends on whether the CloudMonitor agent is installed on the instance.
-
If the CloudMonitor agent is installed, the ECS console displays operating system metrics (CPU utilization, memory usage, and system load) from the agent, plus basic metrics identical to those in CloudMonitor.
-
If the CloudMonitor agent is not installed, the ECS console displays only basic metrics, identical to those in CloudMonitor.
NoteOperating system metrics are collected every 15 seconds; basic metrics every 1 minute. See Operating system monitoring.
The following table lists metrics available without the CloudMonitor agent. Data is collected every 1 minute.
Metric Name
Description
Unit
MetricName
Dimensions
Statistics
(ECS) CPU utilization
CPU usage
%
CPUUtilization
userId, instanceId
Maximum, Minimum, Average
(ECS) Inbound Internet bandwidth (classic network)
Average rate of inbound Internet traffic
bit/s
InternetInRate
userId, instanceId
Maximum, Minimum, Average
(ECS) Inbound private network bandwidth
Average rate of inbound private network traffic
bit/s
IntranetInRate
userId, instanceId
Maximum, Minimum, Average
(ECS) Outbound Internet bandwidth (classic network)
Average rate of outbound Internet traffic
bit/s
InternetOutRate
userId, instanceId
Maximum, Minimum, Average
(ECS) Outbound private network bandwidth
Average rate of outbound private network traffic
bit/s
IntranetOutRate
userId, instanceId
Maximum, Minimum, Average
(ECS) Read BPS for all disks
Total bytes read from the system disk per second
Byte/s
DiskReadBPS
userId, instanceId
Maximum, Minimum, Average
(ECS) Write BPS for all disks
Total bytes written to the system disk per second
Byte/s
DiskWriteBPS
userId, instanceId
Maximum, Minimum, Average
(ECS) Read IOPS for all disks
Read IOPS for all disks
counts/s
DiskReadIOPS
userId, instanceId
Maximum, Minimum, Average
(ECS) Write IOPS for all disks
Write IOPS for all disks
counts/s
DiskWriteIOPS
userId, instanceId
Average, Minimum, Maximum
(ECS) Inbound Internet bandwidth by IP address
Inbound Internet bandwidth
bit/s
VPC_PublicIP_InternetInRate
userId, instanceId, ip
Maximum, Minimum, Average
(ECS) Outbound Internet bandwidth by IP address
Outbound Internet bandwidth
bit/s
VPC_PublicIP_InternetOutRate
userId, instanceId, ip
Maximum, Minimum, Average
(ECS) Outbound Internet bandwidth utilization by IP address
Outbound Internet bandwidth usage
%
VPC_PublicIP_InternetOutRate_Percent
userId, instanceId, ip
Average
(ECS) Inbound Internet traffic (classic network)
Inbound Internet traffic
Byte
InternetIn
userId, instanceId
Average, Minimum, Maximum, Sum
(ECS) Outbound Internet traffic (classic network)
Outbound Internet traffic
Byte
InternetOut
userId, instanceId
Maximum, Minimum, Average
View monitoring data in the CloudMonitor console
CloudMonitor provides end-to-end monitoring solutions for cloud resources, including the host monitoring service for ECS instances. See Operating system monitoring for metric details.
To receive alerts when resource metrics exceed thresholds, create alert rules in CloudMonitor.
-
Log on to the CloudMonitor console.
-
In the left-side navigation pane, click Host Monitoring.
-
(Optional) On the Host Monitoring page, select the target instance. In the lower part of the page, click Batch Install and then click OK.
If the CloudMonitor agent is not installed, you can install it on the instance. See Install and uninstall the CloudMonitor agent.
-
Without the agent, only basic metrics are available in CloudMonitor.
-
With the agent installed, both basic and operating system metrics are available.
-
-
On the Host Monitoring page, click the instance ID. View monitoring data on the Basic Monitoring and OS Monitoring tabs.
NoteMonitoring data is retained for up to 30 days.