Container Service for Kubernetes (ACK) integrates with Simple Log Service (SLS), enabling Service Mesh (ASM) to collect access logs from data plane clusters. This topic shows you how to enable log collection, configure SLS, and view the collected logs.
Background information
An Envoy proxy on the data plane (a Kubernetes cluster added to a service mesh) outputs all access logs. These logs are called Envoy access logs. You can view these logs by running the kubectl logs command. SLS offers a more convenient way to view, collect, and query logs, and to create dashboards.
Prerequisites
An ASM instance is created. For more information, see Create an ASM instance.
Step 1: Install the log component
Existing Kubernetes cluster
Log on to the ACK console. In the left navigation pane, click Clusters.
On the Clusters page, click the name of your cluster. In the left navigation pane, click Components and Add-ons.
On the Add-ons page, search for logtail-ds, and then click Install on the logtail-ds card.
In the Install Comment logtail-ds dialog box, click Confirm.
The version of the logtail-ds component must be 0.16.24.0 or later. For more information about how to upgrade a component, see Manage components.
Add the cluster to the ASM instance. For more information, see Add a cluster to an ASM instance.
New Kubernetes cluster
Log on to the ACK console. In the left navigation pane, click Clusters.
On the Clusters page, click Create Kubernetes Cluster.
In the Component Configurations wizard, find the Log Service section and select Enable Log Service to install the log plug-in on the new Kubernetes cluster.
Select Project: Select an existing Project to manage collected logs.
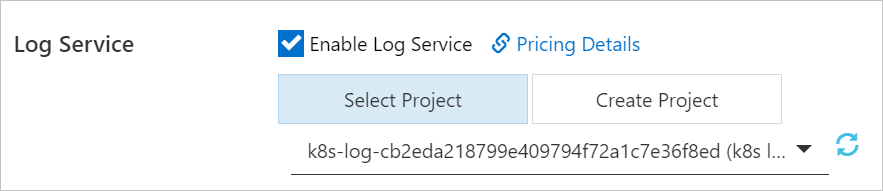
Create Project: Automatically creates a Project to manage collected logs. The Project is automatically named
k8s-log-{ClusterID}, where ClusterID is the unique ID of the new Kubernetes cluster.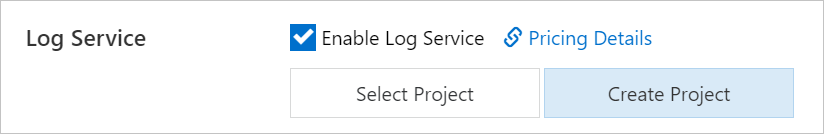
After you complete the configurations, click Create Cluster.
Add the cluster to the ASM instance. For more information, see Add a cluster to an ASM instance.
Step 2: Configure Simple Log Service
To collect Envoy access logs with the Logtail component, you must create a collection configuration.
ASM 1.17.2.35 and later
-
Log on to the ASM console. In the left-side navigation pane, choose .
On the Mesh Management page, click the name of the target instance. In the left-side navigation pane, choose .
On the Log Center page, click the tab or the tab, enter a log retention period, click Enable Sidecar Log Collection, and then in the Confirm dialog box, click OK.
ASM earlier than 1.17.2.35
-
Log on to the ASM console. In the left-side navigation pane, choose .
-
On the Mesh Management page, click the name of the ASM instance. In the left-side navigation pane, choose .
On the Basic Information page, click Settings, select Collect access logs to Alibaba Cloud Log Service, and then click OK.
Step 3: View logs
After the configuration is complete, Envoy access logs are collected and stored in the Project and Logstore that you specified in SLS. Follow these steps to view the logs.
-
Log on to the ASM console. In the left-side navigation pane, choose .
-
On the Mesh Management page, click the name of the ASM instance. In the left-side navigation pane, choose .
On the Log Center page, on the Sidecar Proxy Logs > Data-Plane Logs tab, click Enable Sidecar Log Collection, and then click OK in the confirmation dialog box.
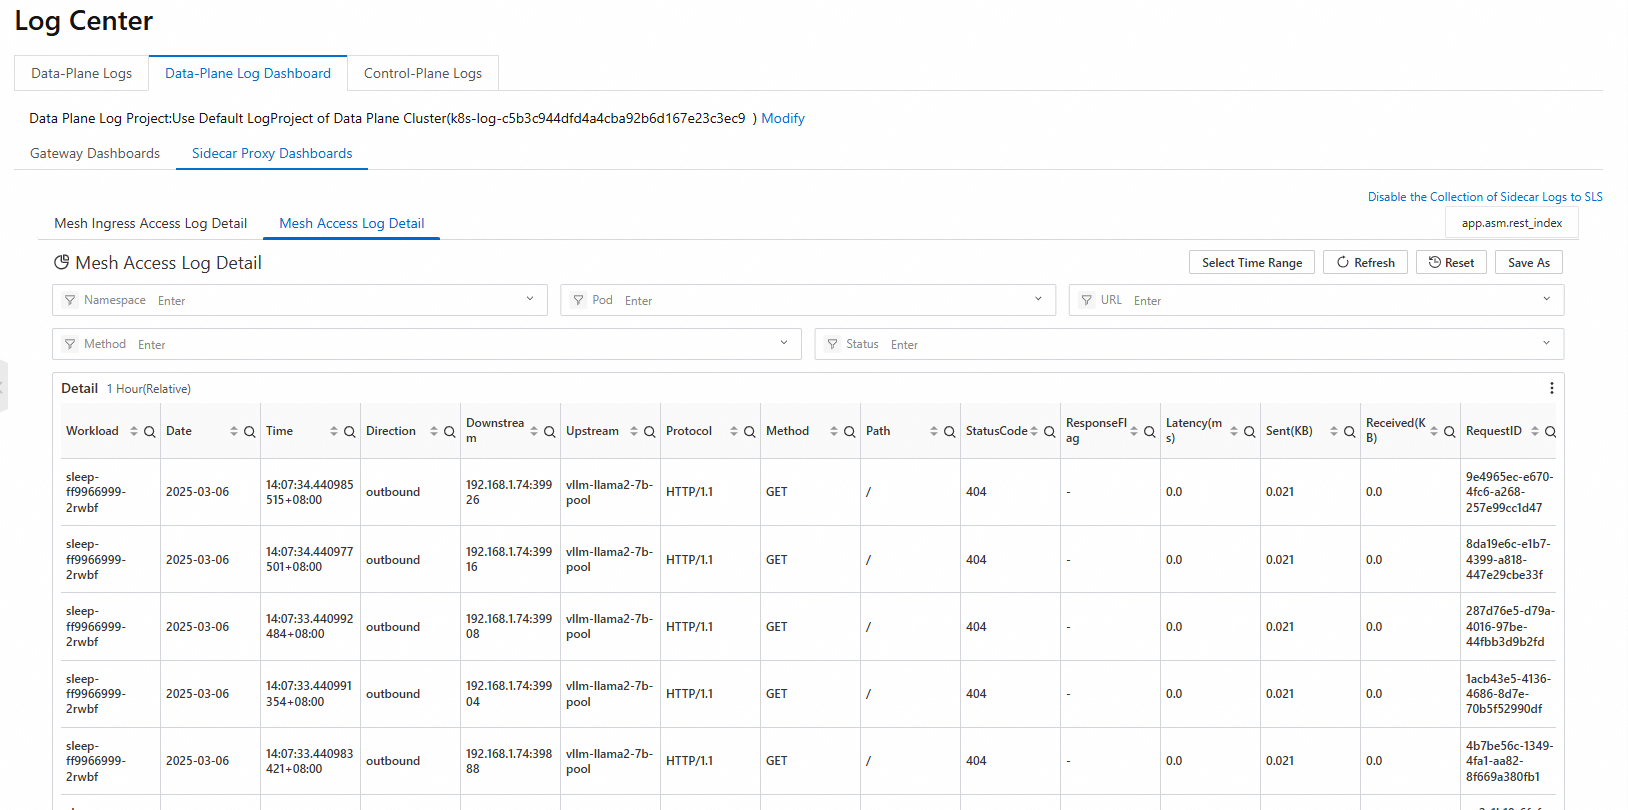
Detailed records: You can choose to view raw access logs in a more readable format.
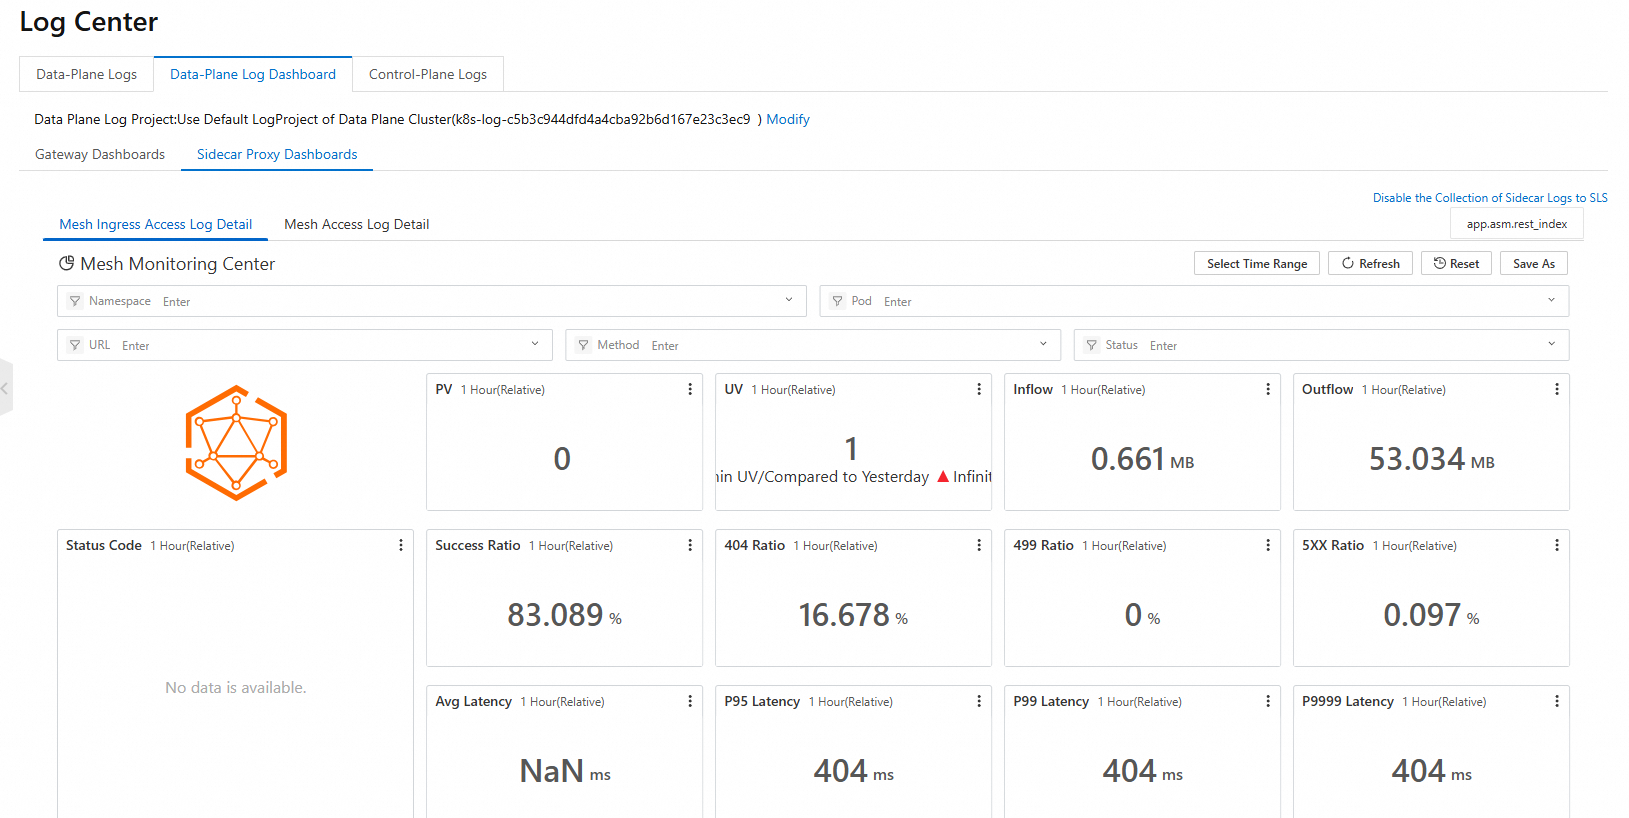
Monitoring center: You can choose to view multidimensional statistical log data.