This topic describes how to query MNS logs in the Log Service console. This topic describes several common scenarios of
real-time query. You can use multiple keywords to run complex queries.
Notice Logs can be pushed from MNS to Log Service about three minutes after the logs are generated.
Log query and analysis
- Log on to the Log Service console.
- In the Projects section, click the destination project.
- On the tab, click the destination Logstore.
- Enter a query statement in the search box.
A query statement consists of a search statement and an analytic statement in the
format of
search statement|analytic statement. For more information, see
Search syntax and
SQL syntax.
- On the Search & Analysis page, click 15 Minutes(Relative) to set the time range for the query.
You can select a relative time, set a time frame, or customize a time range.
Note The query results may contain logs that are generated 1 minute earlier or later than
the specified time period.
- Click Search & Analyze to view the query results.
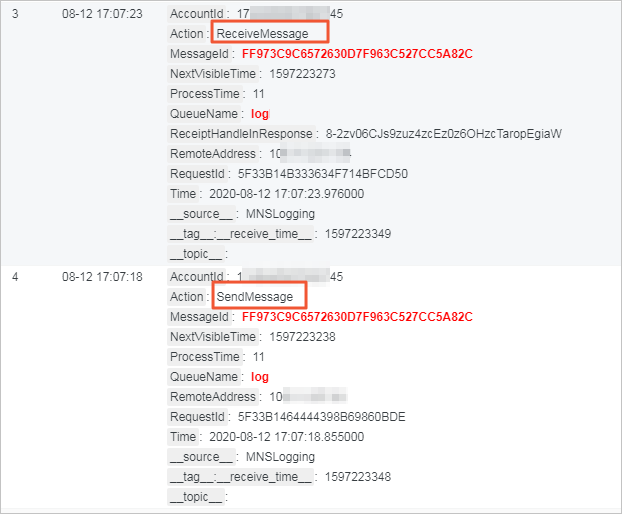
View the tracing of a message in a queue
- Log on to the Log Service console.
- In the Projects list, click the project where the message resides.
- On the page that appears, choose , and then click the Logstore in which the message is stored.
- Enter a search statement.
In this example, the message tracing of a message in a queue is queried. You must
enter the queue name and the message ID in the format of $QueueName and $MessageId, for example, log and FF973C9C6572630D7F963C527CC5A82C.
- In the upper-right corner of the page, click 15 Minutes (Relative) to set a time range for the query.
You can select a relative time, set a time frame, or customize a time range.
Note The query results may contain logs that are generated one minute earlier or later
than the specified time range.
- Click Search & Analyze.
The following query result records the process from the time when the message is sent
to the time when the message is received.
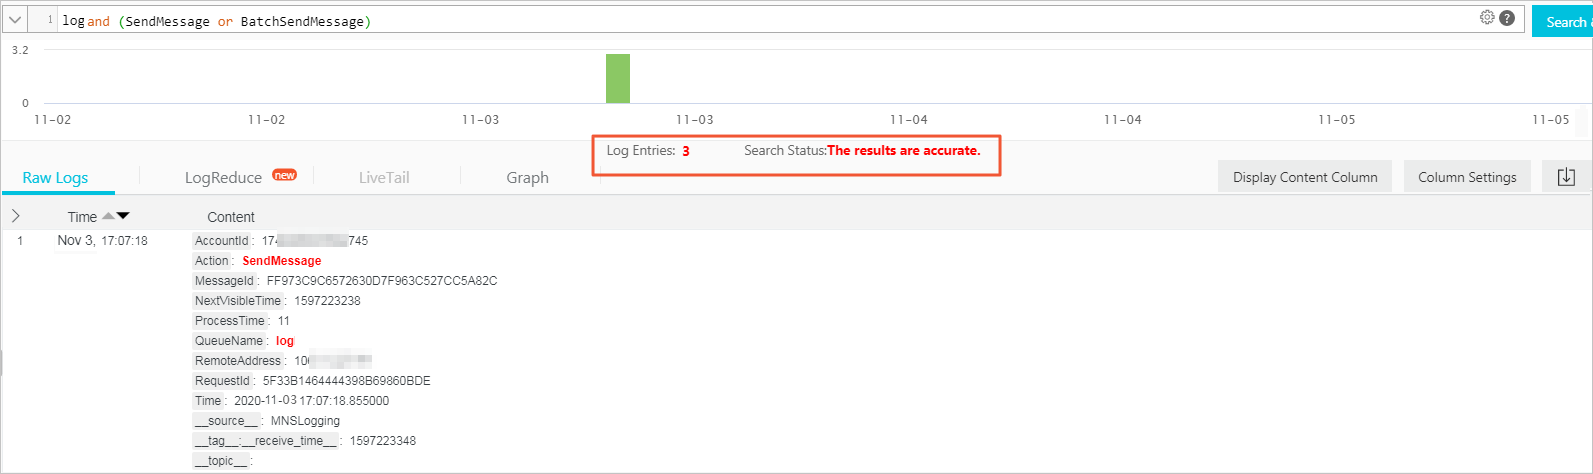
View the number of messages that are sent to Log Service in a queue
- Enter a search statement on the Search & Analysis page of the Logstore where the messages
are stored.
In this example, the number of messages sent in a queue is queried. You must enter
the queue name and send operation in the format of $QueueName and (SendMessage or BatchSendMessage), for example, log and (SendMessage or BatchSendMessage).
- In the upper-right corner of the page, click 15 Minutes (Relative) to set a time range for the query.
You can select a relative time, set a time frame, or customize a time range.
Note The query results may contain logs that are generated one minute earlier or later
than the specified time range.
- Click Search & Analyze.
The following figure shows the query results. Three queue messages are sent by the
message producer to a queue named log in the specified time range.
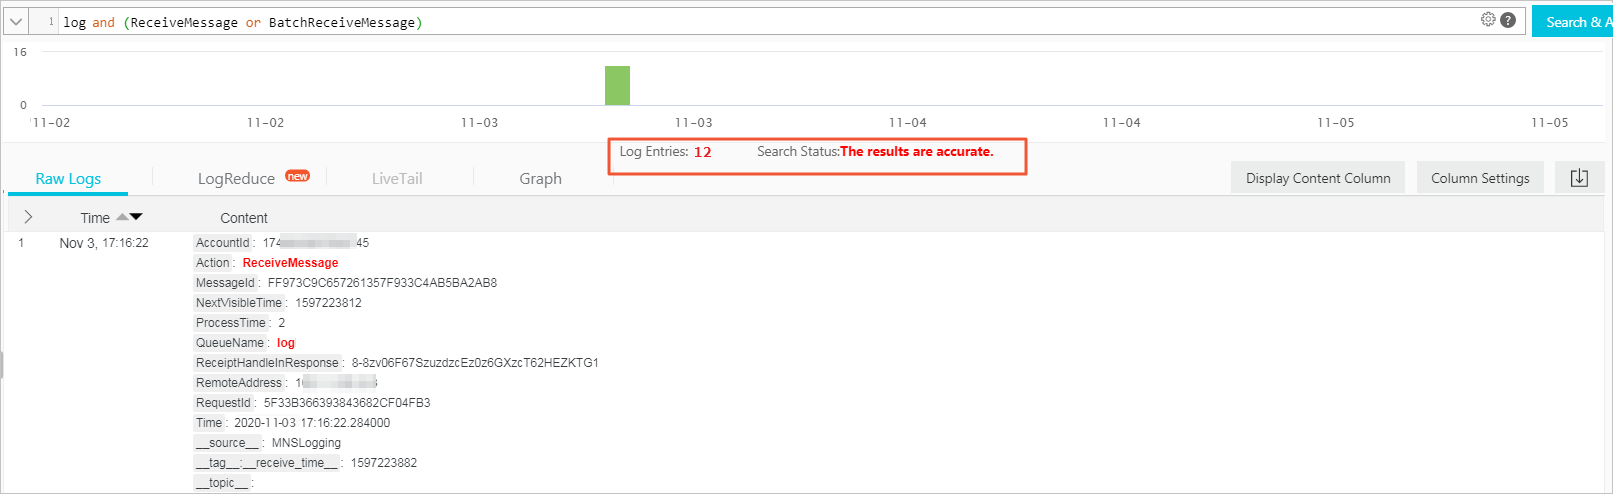
View the number of messages that are consumed by Log Service in a queue
- Enter a search statement on the Search & Analysis page of the Logstore where the messages
are stored.
In this example, the number of messages that are consumed by Log Service in a queue
is queried. You must enter the queue name and consumption operation in the format
of $QueueName and (ReceiveMessage or BatchReceiveMessage), for example, log and (ReceiveMessage or BatchReceiveMessage).
- In the upper-right corner of the page, click 15 Minutes (Relative) to set a time range for the query.
You can select a relative time, set a time frame, or customize a time range.
Note The query results may contain logs that are generated one minute earlier or later
than the specified time range.
- Click Search & Analyze.
The following figure shows the query results. Twelve queue messages are consumed in
the specified time range.
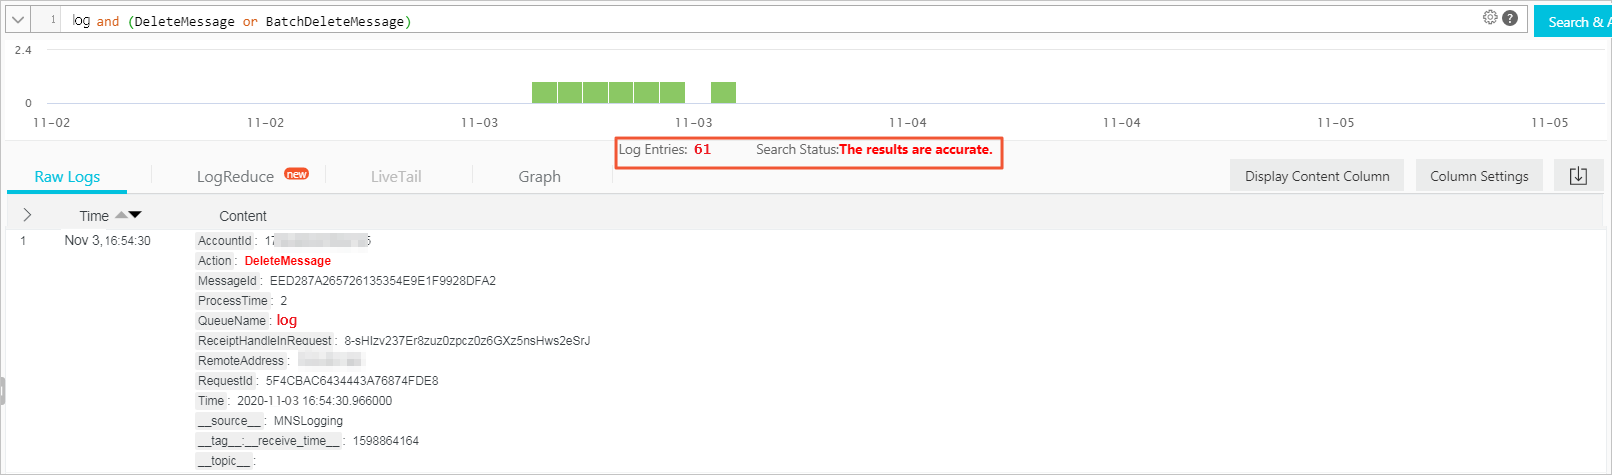
View the number of messages that are deleted from a queue
- Enter a search statement on the Search & Analysis page of the Logstore where the messages
are stored.
In this example, the number of messages that are deleted from a queue is queried.
You must enter the queue name and delete operation in the format of $QueueName and (DeleteMessage or BatchDeleteMessage), for example, log and (DeleteMessage or BatchDeleteMessage).
- In the upper-right corner of the page, click 15 Minutes (Relative) to set a time range for the query.
You can select a relative time, set a time frame, or customize a time range.
Note The query results may contain logs that are generated one minute earlier or later
than the specified time range.
- Click Search & Analyze.
The following figure shows the query results. Sixty-one queue messages are deleted
in the specified time range.
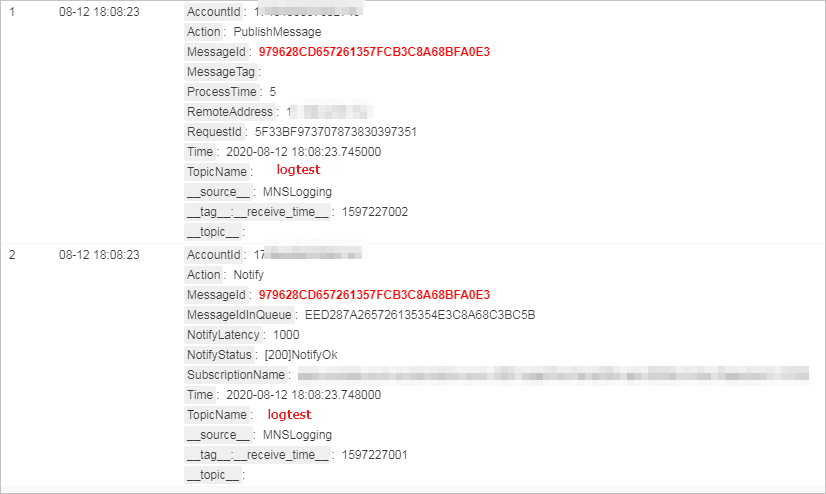
View the tracing of a message in a topic
- Enter a search statement on the Search & Analysis page of the Logstore where the messages
are stored.
In this example, the message tracing of a message in a topic is queried. You must
enter the topic name and MessageId in the format of $TopicName and $MessageId, for example, logtest and 979628CD657261357FCB3C8A68BFA0E3.
- In the upper-right corner of the page, click 15 Minutes (Relative) to set a time range for the query.
You can select a relative time, set a time frame, or customize a time range.
Note The query results may contain logs that are generated one minute earlier or later
than the specified time range.
- Click Search & Analyze.
The following query result records the process from the time when the message is sent
to the time when the message is received.
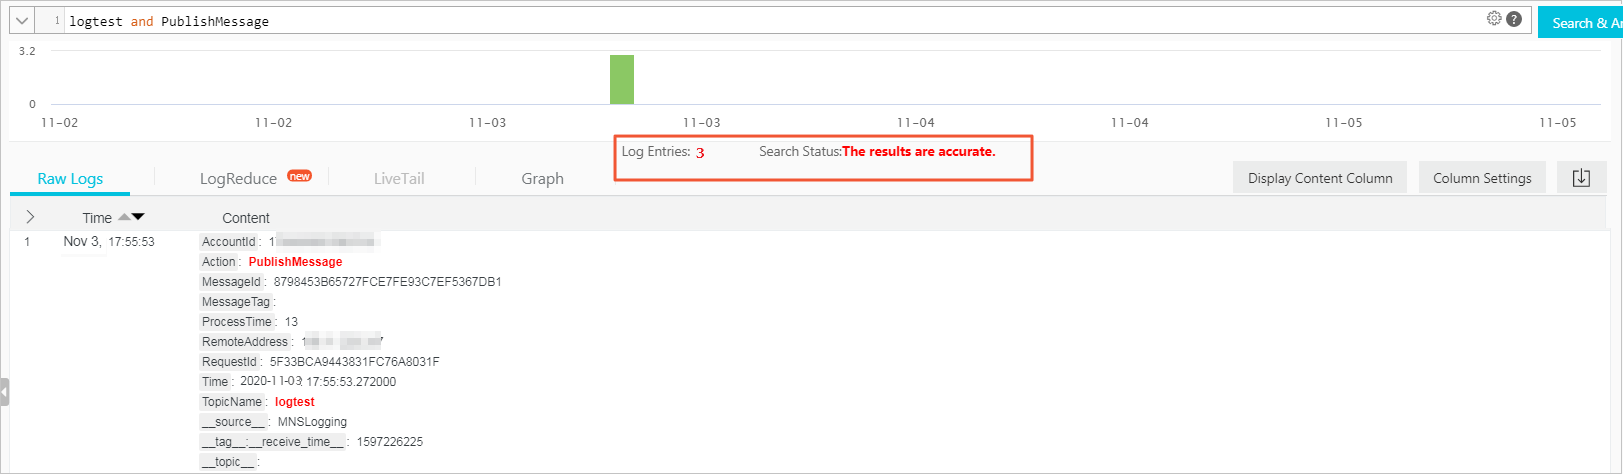
View the number of messages that are published in a topic
- Enter a search statement on the Search & Analysis page of the Logstore where the messages
are stored.
In this example, the number of messages that are published in a topic is queried.
You must enter the topic name and publish operation in the format of $TopicName and PublishMessage, for example, logtest and PublishMessage.
- In the upper-right corner of the page, click 15 Minutes (Relative) to set a time range for the query.
You can select a relative time, set a time frame, or customize a time range.
Note The query results may contain logs that are generated one minute earlier or later
than the specified time range.
- Click Search & Analyze.
The following figure shows the query results. Three messages are published to the
logtest topic in the specified time range.
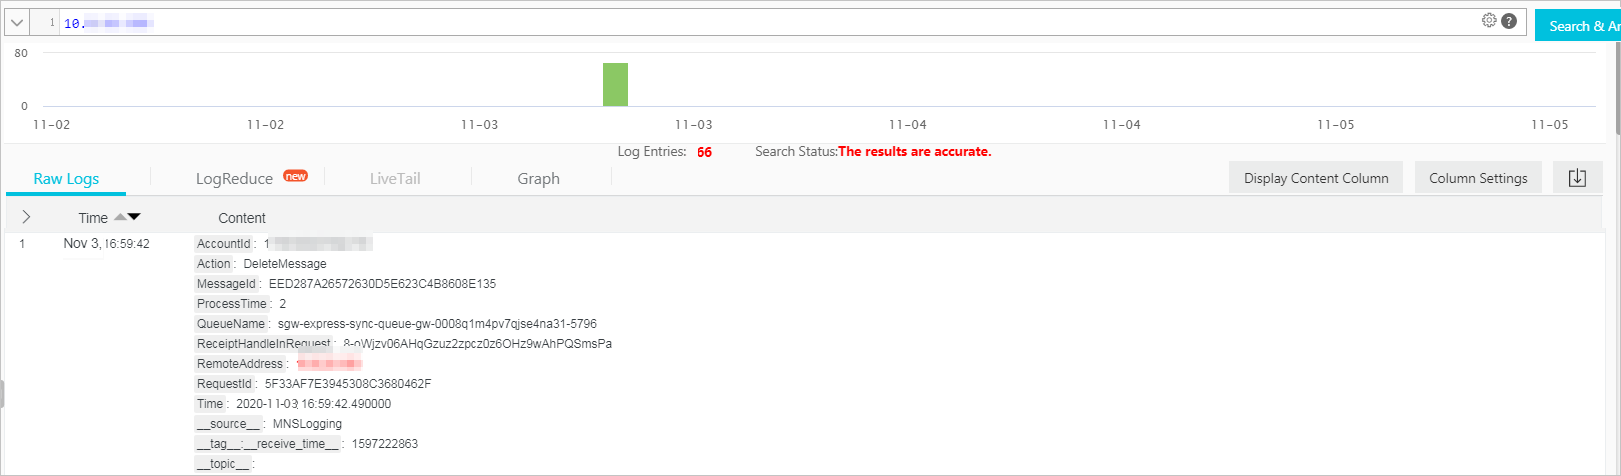
View the number of messages that are processed by a client
- Enter a search statement on the Search & Analysis page of the Logstore where the messages
are stored.
In this example, the number of messages that are processed by a client is queried.
You must enter the client IP address in the format of
$ClientIP, for example,
10.10.10.0.
If you need to query a specific type of operations log, you can use multiple keywords,
for example, $ClientIP and (SendMessage or BatchSendMessage).
- In the upper-right corner of the page, click 15 Minutes (Relative) to set a time range for the query.
You can select a relative time, set a time frame, or customize a time range.
Note The query results may contain logs that are generated one minute earlier or later
than the specified time range.
- Click Search & Analyze.
The following figure shows the query results. The client processed 66 messages in
the specified time range.