When a Logstash pipeline produces output that doesn't match expectations, the typical workflow requires you to check the destination for data issues, return to the console, update the configuration, and redeploy — repeating this cycle until the output is correct. The pipeline configuration debugging feature eliminates that round-trip by letting you view pipeline output data directly in the Alibaba Cloud Elasticsearch console after deployment.
Prerequisites
Before you begin, ensure that you have:
The
logstash-output-file_extendplug-in installed. For instructions, see Install and remove a plug-in
Enable debugging and view output data
Step 1: Open the pipeline creation page
Go to the Logstash Clusters page in the Alibaba Cloud Elasticsearch console.
In the top navigation bar, select the region where your cluster resides.
On the Logstash Clusters page, click the ID of your cluster.
In the left-side navigation pane, click Pipelines.
On the Pipelines page, click Create Pipeline.
Step 2: Configure the pipeline
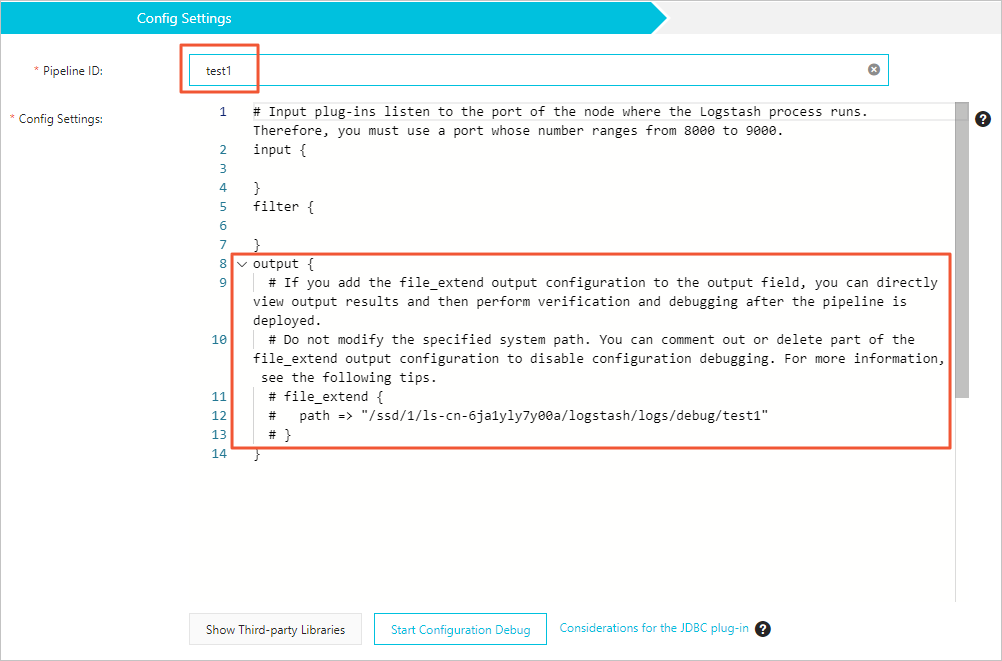
In the Config Settings step, set Pipeline ID and Config Settings. Config Settings sections: The following example reads from a source Elasticsearch cluster and writes to a destination cluster. The
file_extendblock is included for debugging — uncomment it to activate the feature:input: Specifies the data source. All open source Logstash input plug-ins are supported, except the
fileplug-in.filter: Processes the collected data. Numerous filter plug-ins are supported.
output: Sends processed data to the destination. Supports open source Logstash output plug-ins and the Alibaba Cloud
file_extendoutput plug-in. Uncomment thefile_extendblock to enable pipeline configuration debugging.
ImportantThe
file_extendblock in the output section is commented out by default. Uncomment it to enable debugging.The
pathvalue is assigned by the system. Do not change it. Click Start Configuration Debug to get the correct path.{pipelineid}in the path is automatically mapped to your pipeline ID. Do not modify it, or debug logs will not be captured.
Parameter Description Pipeline ID A unique identifier for the pipeline. The system automatically maps this value to {pipelineid}in thepathfield of thefile_extendoutput plug-in.Config Settings The pipeline configuration, consisting of three sections: input,filter, andoutput. See the details below.input { elasticsearch { hosts => "http://es-cn-0pp1jxv000****.elasticsearch.aliyuncs.com:9200" user => "elastic" index => "twitter" password => "<YOUR_PASSWORD>" docinfo => true } } filter { } output { elasticsearch { hosts => ["http://es-cn-000000000i****.elasticsearch.aliyuncs.com:9200"] user => "elastic" password => "<your_password>" index => "%{[@metadata][_index]}" document_id => "%{[@metadata][_id]}" } file_extend { path => "/ssd/1/ls-cn-v0h1kzca****/logstash/logs/debug/test" } }Using the Elasticsearch input plug-in for batch test imports The Elasticsearch input plug-in reads data from a cluster based on the query statement you configure. It is well suited for importing multiple test logs at once. By default, Logstash stops the process after all data is read, then automatically restarts it — which can cause duplicate writes when only one pipeline exists. To prevent duplicates, use the
scheduleparameter with a cron expression to run the pipeline at a fixed interval. After the first run, Logstash stops the pipeline and does not restart it until the next scheduled time. The following example schedules the pipeline to run at 13:20 on March 5 every year:schedule => "20 13 5 3 *"For more details, see Scheduling in the Logstash documentation.
Click Next to configure pipeline parameters. For parameter details, see Use configuration files to manage pipelines.
Save and deploy the pipeline using one of the following options:
Option Behavior Save Saves the pipeline settings and triggers a cluster change, but the settings do not take effect immediately. After saving, go to the Pipelines page, find the pipeline, and click Deploy Now in the Actions column. Save and Deploy Saves the settings and immediately restarts the Logstash cluster to apply them. In the confirmation message, click OK.
Step 3: View debug logs
After the cluster is restarted, the debug logs are ready to view.
On the Pipelines page, find the pipeline and click View Debug Logs in the Actions column.
On the Debug Log tab of the Logs page, review the pipeline output data. If you have multiple pipelines, filter logs by entering
pipelineId: <Pipeline ID>in the search box.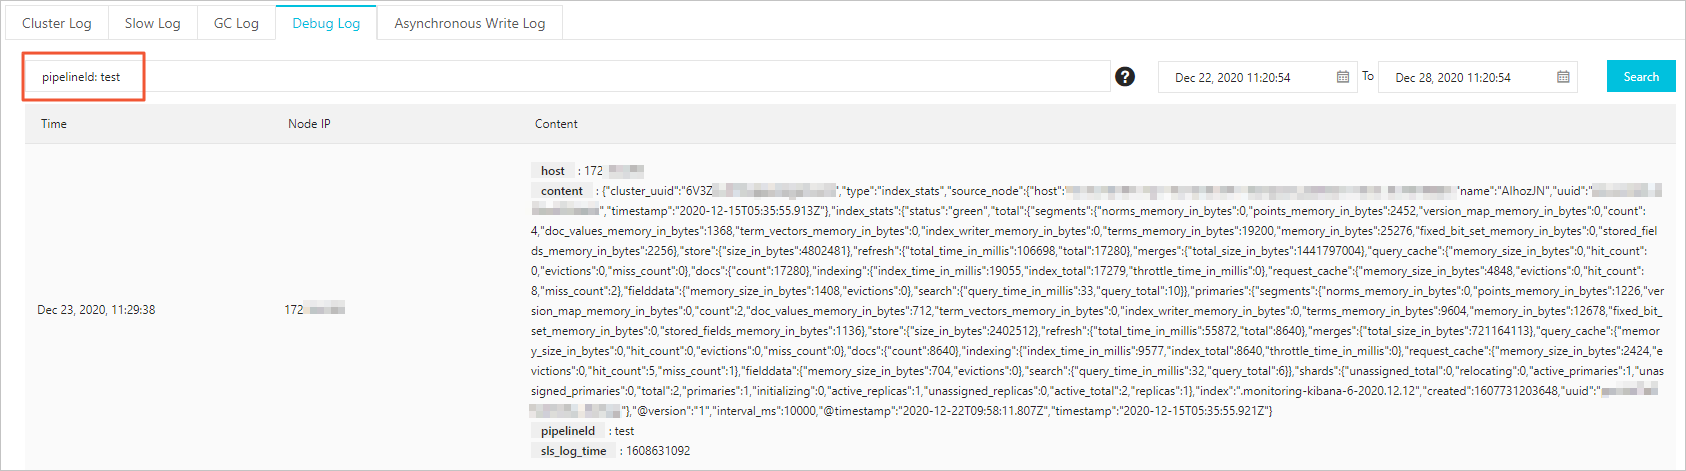
If the output data does not meet requirements, return to the pipeline configuration, adjust Config Settings, and redeploy.