DataAnalysis provides 22 controls categorized into 7 types. You can choose the controls to use based on your business requirements. This topic describes how to add a line chart to a report, configure a data store for the line chart, and edit the line chart.
Go to the report editing page
- Go to the DataAnalysis page.
- In the top navigation bar, click .
- In the All Reports section of the page, click the name of the report that you want to edit in the File Name column to go to the report editing page.
Add a line chart and configure a data store
- On the report editing page, click Tendency Chart and drag the Line Chart control to the canvas.
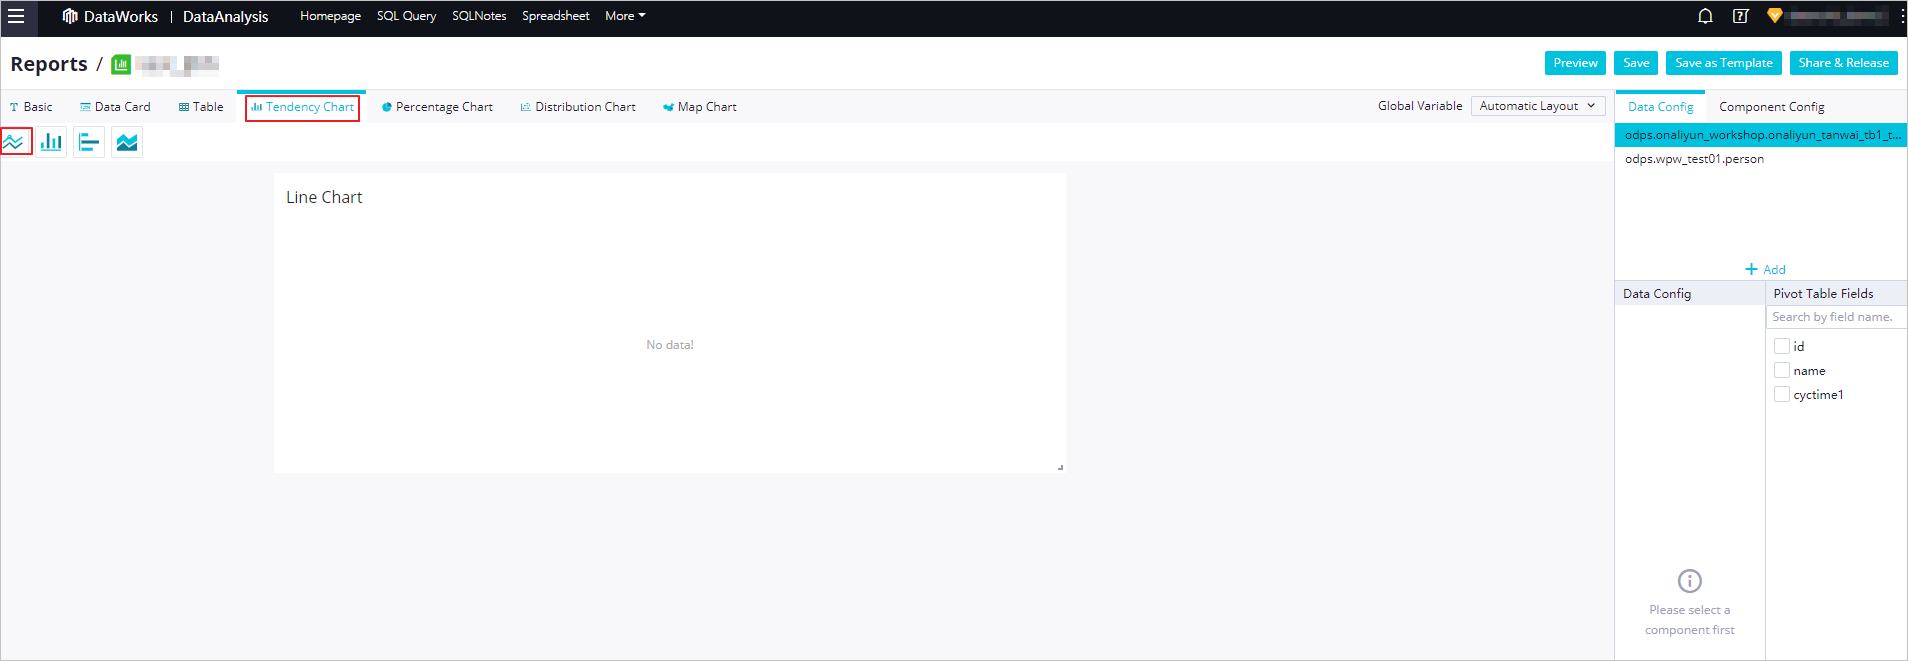
- On the Data Config tab on the right side of the report editing page, click Add.
- In the Create Pivot Table dialog box, specify the range of the data to be analyzed.You can set Choose Data to Select a spreadsheet or Use External Data Source as needed.
- Select a spreadsheetYou can specify a sheet from a workbook under the current account as the data store.
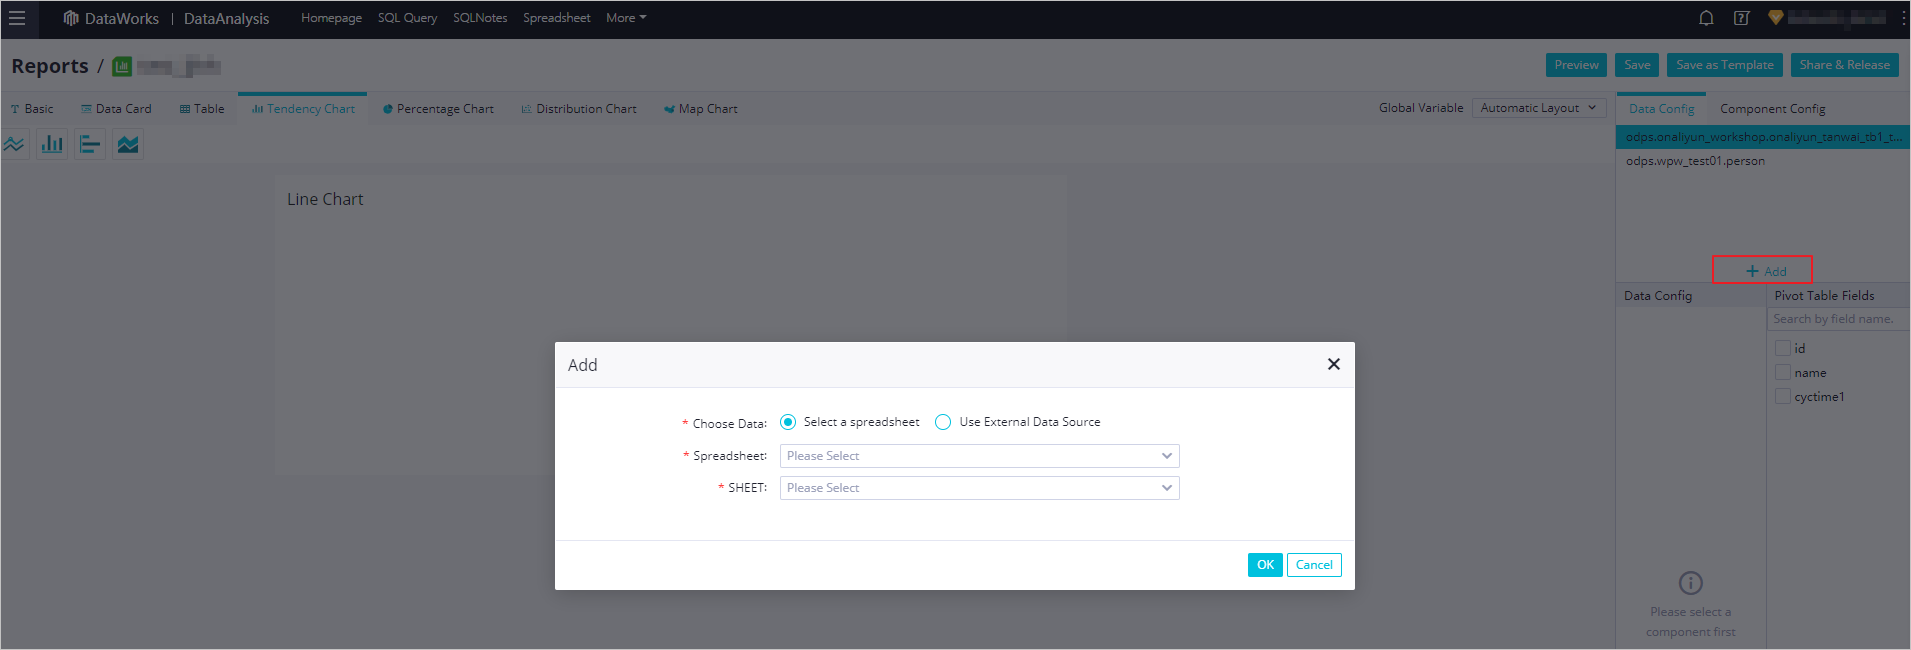 Note A sheet of a pivot table cannot be used as the data store.
 - Use External Data Source
Select a data store of the MaxCompute, Mysql, Data Services, OSS, or PostgreSQL type as needed. If you set Choose Data to Use External Data Source, make sure that the connection to the data store or the API for obtaining the source data has been configured. For more information, see Connection configuration.
Multiple charts can use the same data store in different ways without affecting each other. One chart can use only one data store. After you select a chart and drag fields from the Pivot Table Fields section to the Data Config section, the chart is associated with the data store.
- Select a spreadsheet
Configure data for the line chart
The parameters that need to be set vary with the chart type. For more information, see Charts. For example, you must specify the X-Axis and Y-Axis parameters for a line chart.
- On the right side of the report editing page, drag fields from the Pivot Table Fields section to X-Axis and Y-Axis in the Data Config section.
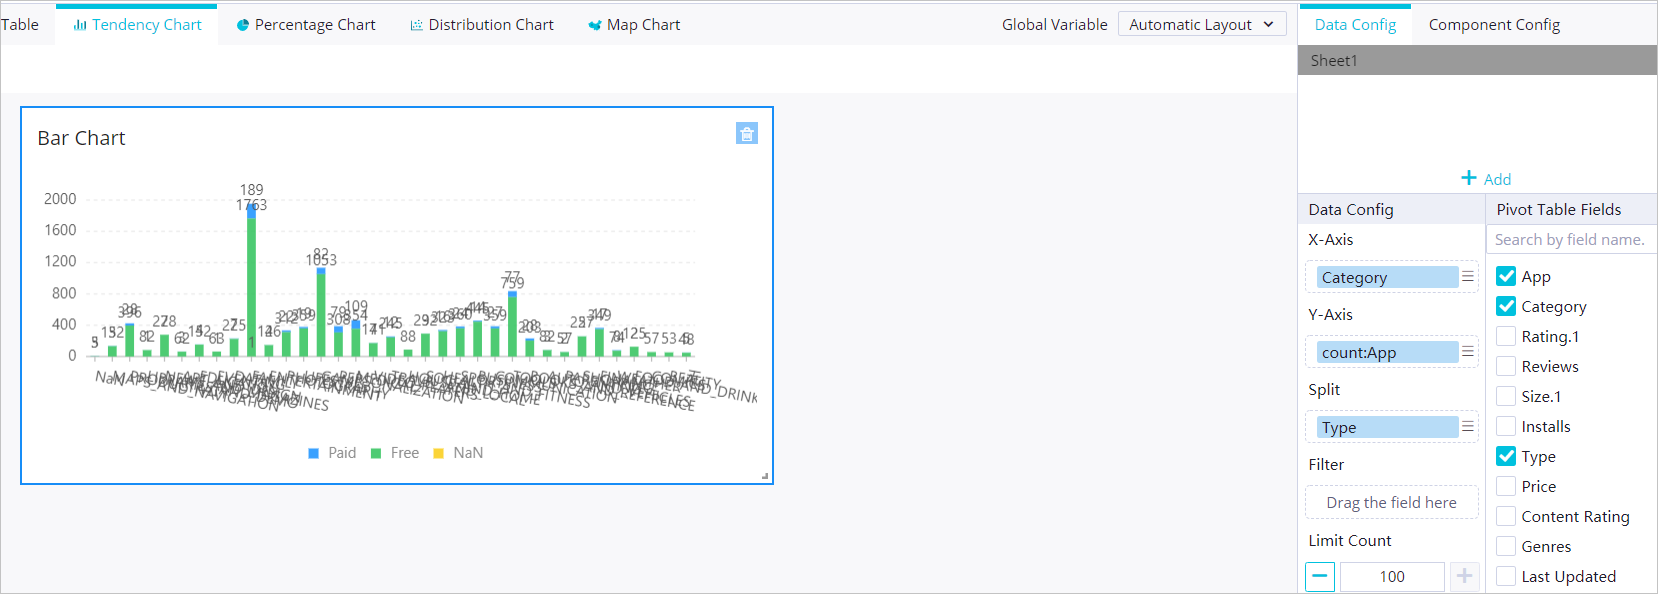
You can choose whether to set the Split parameter based on your business requirements.
- Click Global Variable in the menu bar. In the Global Variable dialog box, specify Key and Value.In the Global Variable dialog box, you can specify custom filter conditions. For example, set Key to sex and Value to male. That is, set sex=male as the filter condition.
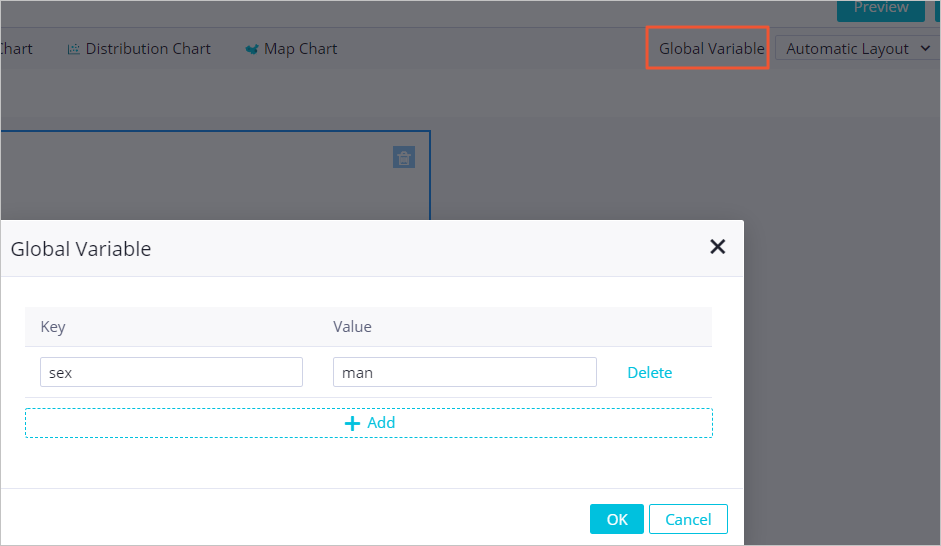
- Click OK.
- On the right side of the report editing page, drag fields from the Pivot Table Fields section to Filter in the Data Config section.
- In the Screening dialog box, enter the variable name.Note Variable names are in the ${} format.
- Click OK. Only field values that meet the specified filter condition are displayed in the line chart.
Configure the line chart settings
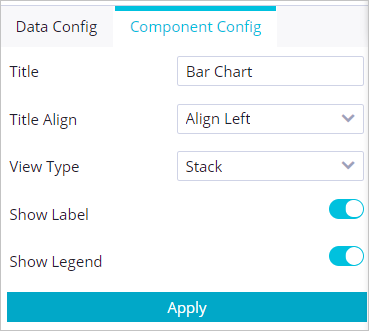
The parameters that need to be set vary with the control type. You can set the parameters based on the content to be displayed.