Filters are core components used for dynamically screening and controlling visualization data. This topic systematically introduces the methods for configuring, managing, and applying filters in multiple scenarios.
Background information
Introduction to principles
Filters are important features in data visualization for implementing dynamic data interaction. They filter raw data in real time based on user-defined condition rules (such as numerical intervals and text matching) and update the results to all associated visualization widgets.
Scenarios
Filters are widely used in data visualization, mainly for dynamically controlling the display of data content. Typical scenarios include the following:
In sales reports, displaying performance data for only a specific region.
In real-time monitoring dashboards, filtering out abnormal values (such as temperature data exceeding thresholds).
Combined with dropdown menus or sliders, allowing users to select the data range they want to view.
Preparations
Prerequisites
You have created a visualization application.
Access the canvas editor
Before configuring filters and performing related operations, follow these steps to access the canvas editor:
Access the DataV console.
On the My Visualizations page, hover your mouse over the target application and click Edit to access the canvas editor page.
Create a filter
You can create a filter using the following two methods.
Created filters are displayed in the Data Filters list and can be called by widgets within the application. After a filter is called, the system automatically displays the dependency relationship between the filter and widgets.
Create a filter in the panel
On the Canvas Editor page, click the data filter
 icon in the top toolbar to access the Data Filters panel, and then click Create.
In the filter configuration area, enter the filter name and custom filter code, and then click Save.
Create a filter in a widget.
On the Canvas Editor page, click the asset list
 icon in the top toolbar.
Add a widget in the asset list (a column chart is used in this example), and click the Data icon in the configuration panel on the right.
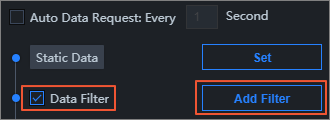
In the Data configuration panel, select Data Filter and click Add Filter.
On the Set Data Source page, click
 on the right side of the filter.
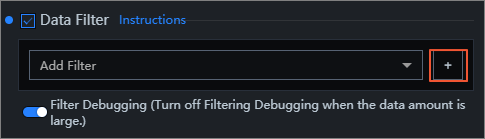
In the Data Filter configuration panel, enter the filter name and custom filter code, and then click Save.
Manage filters
Filter panel
In the Data Filters panel on the left side of the visualization application, you can manage filters for all widgets in the application and view the dependency relationships between filters and widgets. Filters in the panel can be added and used by any widget in the visualization application.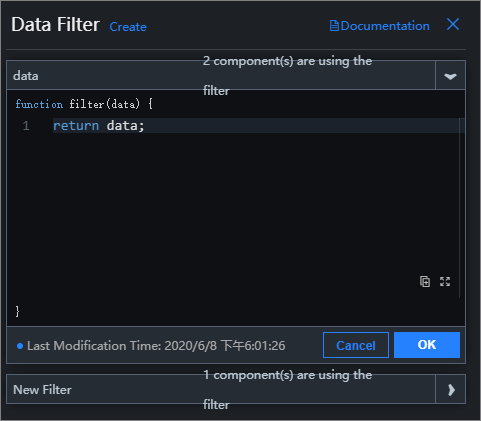
When you modify the configuration of a filter in the filter panel, all widgets that depend on this filter become unavailable. Make sure you understand the scope of impact before saving the changes.
Basic operations
Rename a filter: Hover your mouse over the target filter, click the
 icon, and enter the filter name.
Delete a filter: Hover your mouse over the target filter and click the
 icon to delete the filter.Important
Deleting a filter may cause related widgets to become unavailable. Confirm before proceeding.
Add a filter
In the Data configuration panel of the widget, select Data Filter and click Add Filter.
On the Set Data Source page, select an existing filter from the Add Filter list.
Sort filters
Filter order: After you add multiple filters to a widget data source, data is processed sequentially through each filter from top to bottom: The input of the first filter is the original result directly returned by the data source. The input of the second filter is the output data processed by the first filter. Subsequent filters follow this pattern, with each filter processing based on the output result of the previous filter. The final output is the data result after cascade processing by all filters.
If a filter in the middle returns an empty value, that filter is ignored, but the filtering does not stop, and the system provides a prompt on the multiple filter configuration page.
If a filter execution reports an error, the filtering stops and uses the result from the last correct execution.
Debug filters
The filter debugging feature ensures the correctness of filter code but is not suitable for large data volumes.
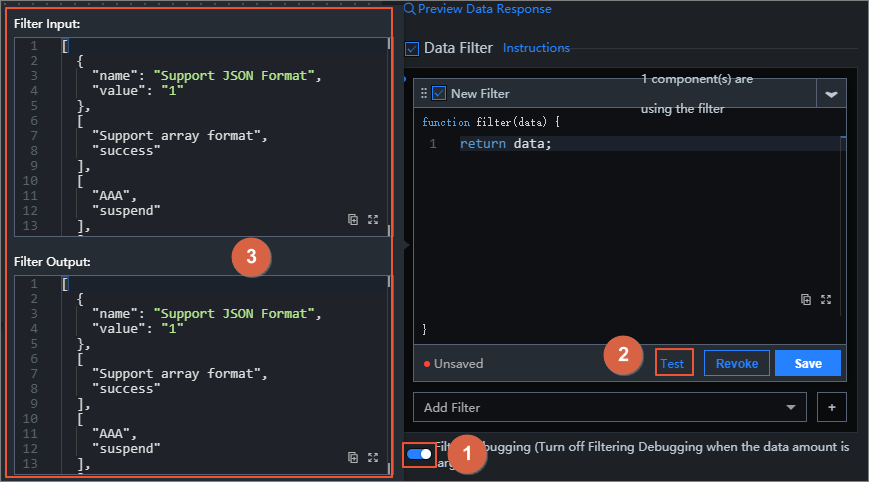
On the Set Data Source page, click Enable Filter Debugging below Data Filter.
Edit the filter code and click Test when you are finished.
After the test is successful, the data filtering results are displayed. As shown in the following figure, the upper and lower parts of the dialog box on the left display the return results before and after the data passes through the filter.
Use filters
This example uses Bilibili web video data to demonstrate how to use data filters with list carousel column chart widgets to implement data screening.
- Log on to the DataV console.
On the My Visualizations page, select the visualization application you created and click Edit to access the canvas editor.
On the Canvas Editor page, click the
 icon to open the Asset List, and enter List Carousel Column Chart in the search box.
Select the current widget and click the Data
 icon in the right panel.
Click Configure Data Source to access the Set Data Source page. In the Data Source Type list, select API, and enter the Bilibili URL link for the source data (
https://api.bilibili.com/x/web-interface/ranking) in the data source edit box. Select Server Proxy Request (this data request is in cross-domain mode).Click Preview Data Source Response to view the source data response.

In the preview page, you can see that the response is a JSON object. However, the List Carousel needs to display a list of objects, with each object containing
valueandcontentfields. Therefore, you need to perform the following steps to configure a data filter to transform the data structure.Click the icon next to Add Filter
to add a filter.Edit the code content in the filter and click Save to view the data filtering results.return data.data.list.map(item => { return { value: item.author, content: item.title }; });After the filter code is edited, you can see the transformed data list required by the widget, with the content displayed in the
valueandcontentfields. Note
NoteYou can also click the
 icon in the data response result to copy it locally for viewing.
Create and import code snippets
You can reuse filters across multiple visualization applications by creating or importing code snippets. The specific creation steps are as follows.
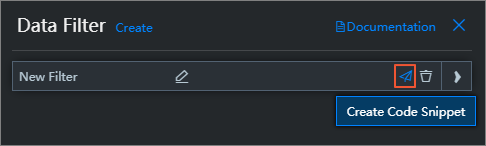
Move your mouse over a filter in the filter list and click the Create Code Snippet icon.
In the dialog box that appears, view and modify the Name and Code, and then click OK.
After the code snippet is successfully saved, on the My Data page, click Code Snippet Management to view and manage code snippets.
 Note
NoteYou can also click Create at the top of the list on the Code Snippet Management page to create a new code snippet and save it to the list below for widget use.
After the code snippet is successfully created, you can continue with the following steps to import the code snippet into a widget for application.
Right-click in the filter code edit box and select an existing code snippet from the import dialog box to complete the code snippet import.
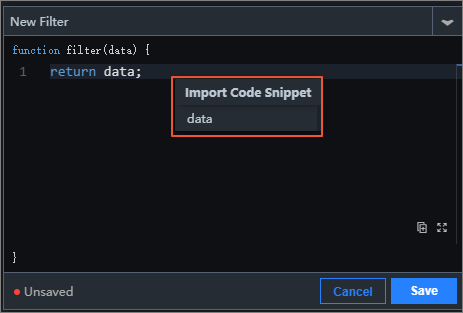 Note
NoteThe import code snippet feature enables sharing and reuse of filter code between multiple visualization applications.
Common errors
Data Source Error: After adding a data filter in the widget data panel, if you switch the current data source to another type, the following two errors are displayed in the data panel, prompting the user that there is a problem with the data source configuration.
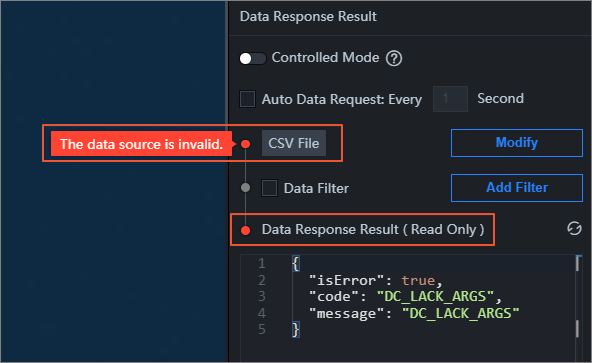 Important
When the data source is abnormal, even if the interface returns data content, the filters in the data panel remain disabled (grayed out). Because the data flow already has an exception at the source, subsequent filtering processing no longer has practical significance.
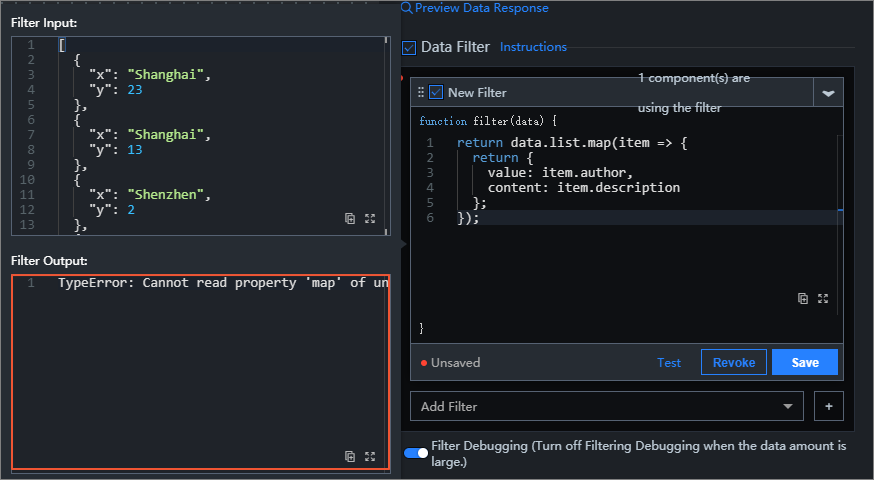
Filter Error: During the filtering process, if the code execution encounters an error, error prompts are displayed in two places on the interface.
Figure 1. Error 1
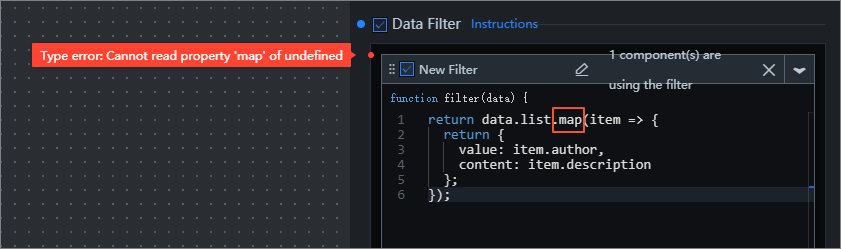
Figure 2. Error 2
References
For more information, see More ways to use filters in different widgets.