When traffic patterns follow predictable daily cycles, reactive scaling alone can cause delays during traffic spikes. Advanced Horizontal Pod Autoscaler (AHPA) addresses this by performing predictive scaling based on historical metrics such as requests per second (RPS), concurrency, CPU, and memory usage. Combined with cron-based instance bounds, AHPA lets you define minimum and maximum replica counts for specific time windows, so your Knative Services scale proactively instead of reactively.
Prerequisites
Before you begin, make sure that you have:
-
Knative is deployed in your cluster. For more information, see Deploy and manage Knative.
-
AHPA deployed. For more information, see Deploy AHPA
Step 1: Configure AHPA metrics for auto scaling
Create an AHPA configuration file and deploy it to the cluster.
apiVersion: autoscaling.alibabacloud.com/v1beta1
kind: AdvancedHorizontalPodAutoscalerTemplate
metadata:
  name: ahpa-demo
spec:
  metrics:
  - type: Resource
    resource:
      name: rps
      target:
        type: Utilization
        averageUtilization: 10 # RPS threshold set to 10.
  maxReplicas: 50 # Maximum number of replicas set to 50.
  minReplicas: 0 # Minimum number of replicas set to 0.
  prediction:
    quantile: 95 # Prediction confidence level set to 95%.
    scaleUpForward: 180 # Forward prediction time range set to 180 seconds.
# Replica counts are bounded by the AHPA-defined max and min from 2023-06-01 to 2123-06-01.
  instanceBounds:
  - startTime: "2023-06-01 00:00:00"
    endTime: "2123-06-01 00:00:00"
    bounds:
# 0:00 AM - 6:00 AM: min 0, max 50
    - cron: '* 0-6 ? * *'
      maxReplicas: 50
      minReplicas: 0
# 7:00 AM - 9:00 AM: min 5, max 50
    - cron: '* 7-9 ? * *'
      maxReplicas: 50
      minReplicas: 5
# 10:00 AM - 4:00 PM: min 10, max 50
    - cron: '* 10-16 ? * *'
      maxReplicas: 50
      minReplicas: 10
# 5:00 PM - 11:00 PM: min 2, max 50
    - cron: '* 17-23 ? * *'
      maxReplicas: 50
      minReplicas: 2
The following table describes the AHPA parameters.
|
Parameter |
Required |
Description |
|
metrics |
Yes |
The metrics used for auto scaling. Supported metrics: RPS, concurrency, CPU, and memory. |
|
maxReplicas |
Yes |
The maximum number of replicas allowed. |
|
minReplicas |
Yes |
The minimum number of replicas guaranteed. |
|
instanceBounds |
No |
A time window that constrains replica counts to the AHPA-defined maximum and minimum. Contains |
|
bounds |
No |
The maximum and minimum replica counts within a specific time period. Contains: |
Cron expression fields
The following table describes the fields in a cron expression. For more information, see Cron expressions.
|
Field |
Special character |
Required |
Description |
|
Minutes |
* / , - |
Yes |
Valid values: 0 to 59. |
|
Hours |
* / , - |
Yes |
Valid values: 0 to 23. |
|
Day of month |
* / , - ? |
Yes |
Valid values: 1 to 31. |
|
Month |
* / , - |
Yes |
Valid values: 1 to 12 or JAN to DEC. The values JAN to DEC are not case-sensitive. |
|
Day of week |
* / , - ? |
No |
Valid values: 0 to 6 or SUN to SAT. The values SUN to SAT are not case-sensitive. If not specified, any day of the week is applied, which is equivalent to the wildcard character ( |
Special characters used in cron expressions:
-
An asterisk (
*) indicates any value. For example,*indicates any minute or hour. -
A forward slash (
/) indicates the step size. For example,/5indicates every five time units. -
Commas (
,) are used as delimiters. For example,1,3,5indicates values 1, 3, and 5. -
Hyphens (
-) are used in value ranges. For example,1-5indicates values 1 to 5. -
Question marks (
?) are used only in the Day of month and Day of week fields to indicate variable values.
Step 2: Create a Knative Service and enable AHPA
After you deploy AHPA, you can use it through a Knative Service.
Log on to the Container Service Management Console . In the navigation pane on the left, click Clusters.
On the Clusters page, click the name of your cluster. In the navigation pane on the left, click .
-
On the Services tab of the Knative page, set Namespace to default, click Create from Template, copy the following YAML content to the editor, and then click Create to create a Service named helloworld-go-demo.
apiVersion: serving.knative.dev/v1
kind: Service
metadata:
  name: helloworld-go-demo
spec:
  template:
    metadata:
      annotations:
        autoscaling.knative.dev/class: ahpa.autoscaling.knative.dev # Specify the AHPA plugin.
        autoscaling.knative.dev.alibabacloud/ahpa-template: "ahpa-demo" # If you modify the AHPA template parameter, the corresponding revision is also updated.
    spec:
      containers:
      - image: registry.cn-hangzhou.aliyuncs.com/knative-sample/helloworld-go:73fbdd56
        env:
        - name: TARGET
          value: "Knative"
After the Service is created, record the gateway address and domain name. You need them in Step 3.
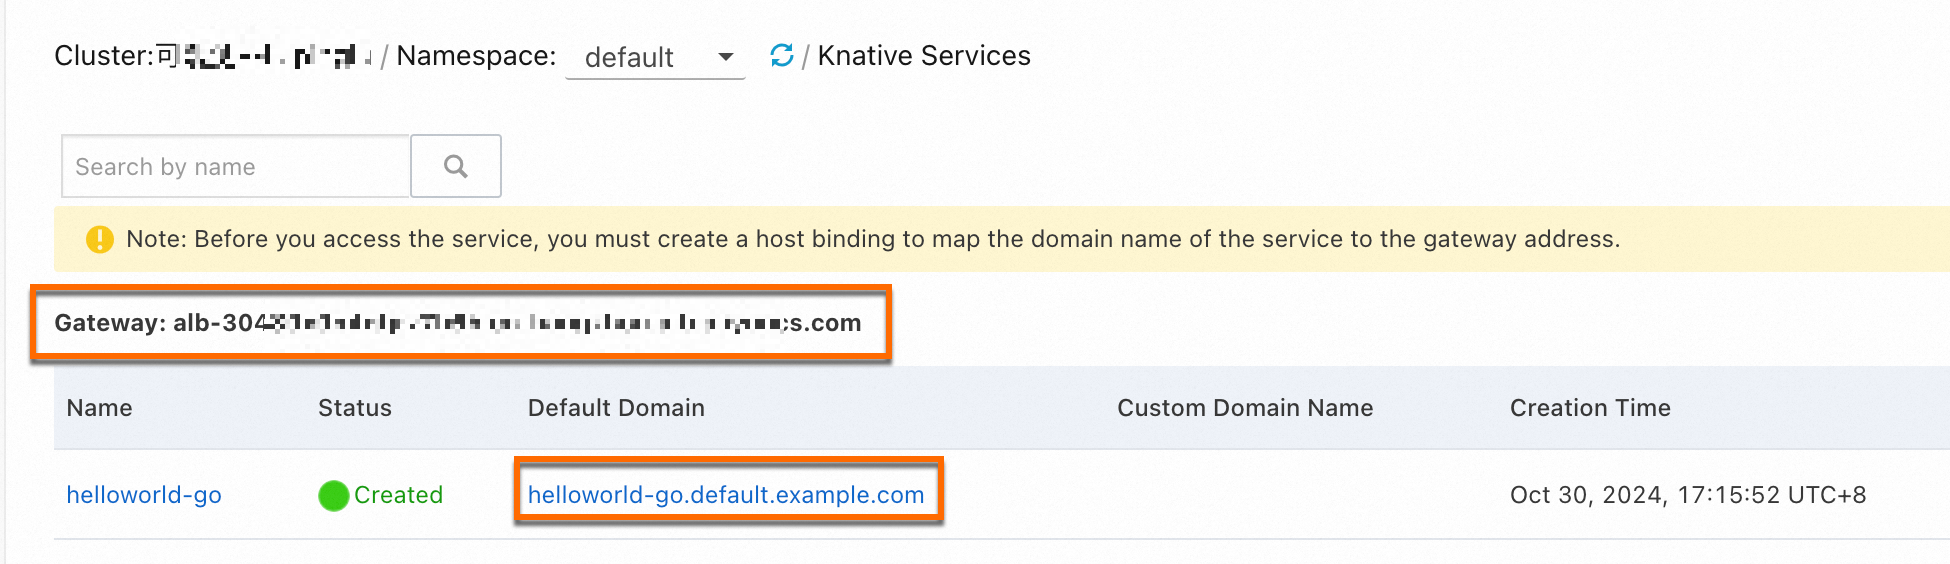
Step 3: Access the Service
Run the following command to access the Service:
# helloworld-go-demo.default.example.com is the default domain name of the Service.
# alb-i5lagvip6fga******.cn-shenzhen.alb.aliyuncs.com is the gateway address of the Service.
curl -H "Host: helloworld-go-demo.default.example.com" http://alb-i5lagvip6fga******.cn-shenzhen.alb.aliyuncs.com
Expected output:
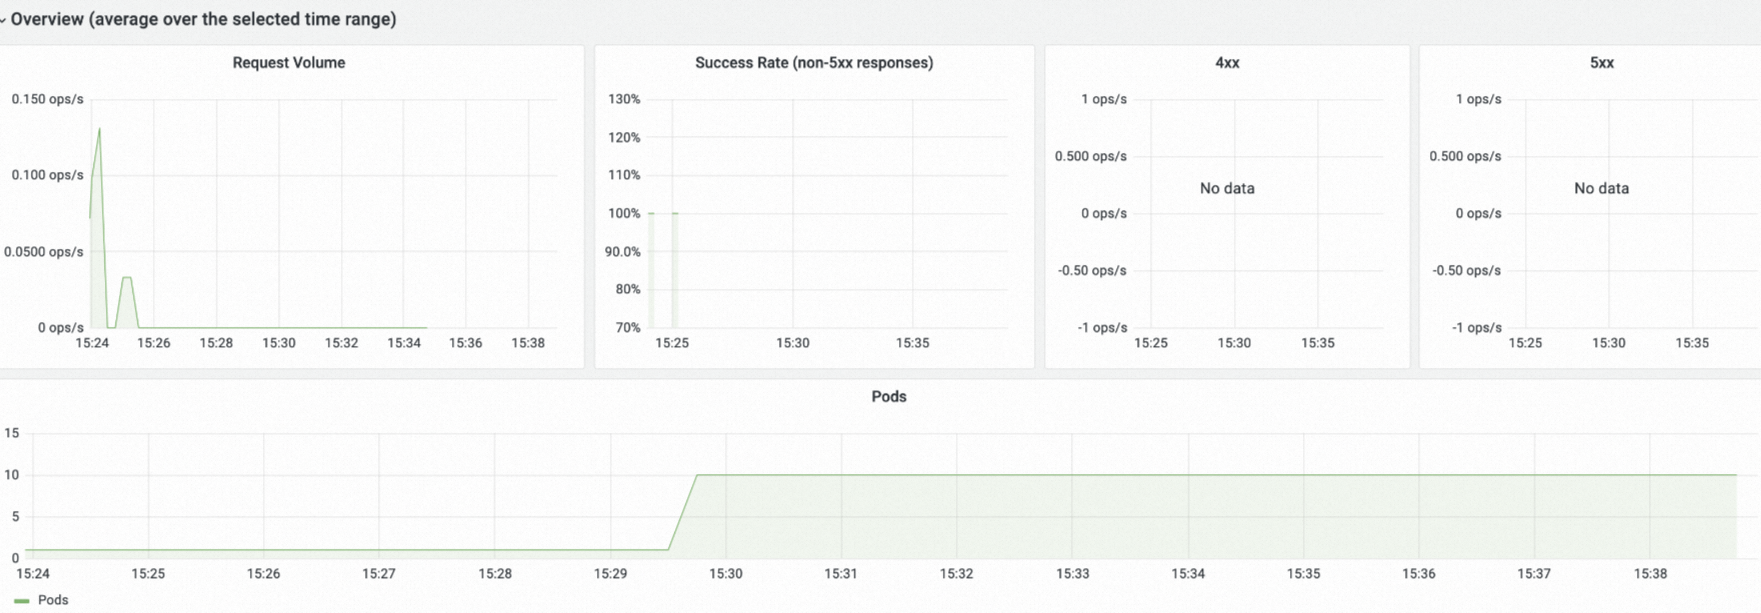
Hello Knative!Step 4 (optional): Verify scheduled scaling
On the Monitoring Dashboards of Knative, you can view the trends of pod scaling for the Knative Service. For more information about the Knative dashboard, see View the Knative monitoring dashboard.
If a Knative application scales to zero pods, Prometheus cannot collect metrics for the pods, such as the number of concurrent requests and requests per second. These metrics appear on the console only after the Knative application pods are accessed.
If a Knative application has not scaled to zero pods, the console displays metrics for the pods, such as the number of concurrent requests and requests per second, even if the pods are not accessed.
References
For information about configuring auto scaling based on concurrent pod requests and RPS, see Enable auto scaling to withstand traffic fluctuations.