After a service instance is created, you can view the events and monitoring information about the service instance in the Compute Nest console. This topic describes how to view the events and monitoring information about a service instance.
Procedure
Log on to the Compute Nest console.
In the left-side navigation pane, click Service Instance.
Click a tab based on the type of your service instance.
Find the service instance that you want to manage and click its ID to go to the service instance details page.
On the service instance details page, view the events and monitoring information about the service instance.
View the events. For more information, see Overview.
View the monitoring information.
Tab
Description
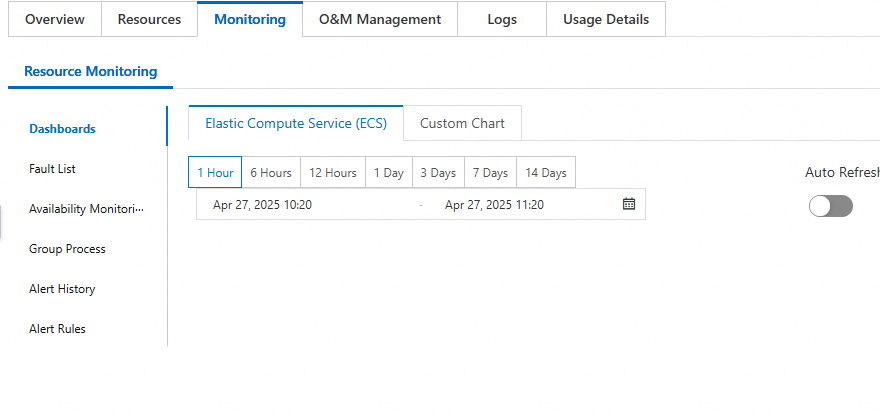
Dashboards
Displays the overall performance information about the service instance. The monitoring metrics include the CPU, system disk, and network.
You can also specify or select a time period based on your business requirements to view the monitoring information within the specified time period.
Fault List
Displays all resources for which alerts are triggered in the current application group. If an alert rule that triggers alerts is disabled, the information about alerts triggered by the disabled rule is no longer displayed.
Availability Monitoring
Displays the monitoring information about the service instance availability.
Group Process
Displays the information about each process monitoring task, including the ID, dynamic alert rule matching, and status.
You can also click Create Process Monitoring Task to create a new process monitoring task as prompted.
Alert History
Displays the alert history trends and alert history information.
Alert Rules
Displays the information about each alert rule, including the status, name, service name, rule description, and alert contact group.
You can also create new alert rules and use new alert templates on this tab.