How it works
The heatmap analysis feature helps you gain insights into the performance of your message flows. It visualizes the number of runs, run percentage, and run errors for each node. This information helps you optimize your flow design and improve the overall response rate.
Procedure
Log on to the Chat App Message Service console, and in the navigation pane on the left, click Flow Editor.
Select the target flow and click its Flow Name.
On the flow editing page, click the Heatmap Analysis tab.
On the Heatmap Analysis page, select a Time Range. By default, the query retrieves data for the current day.
(Optional) You can switch between versions of the heat map analysis data by clicking the Historical Versions icon on the left of the workflow editing area.
Examples
If you adjust the position of a component or make other changes within the same flow version, set a precise query range to prevent data discrepancies.
Heatmap analysis includes the following data types:
Runs:
The total number of times a component ran within the specified time range. This is shown in a green box.
For example,
1 run (100.00%)indicates that the component ran one time.Run percentage:
The percentage of component runs relative to the total number of flow triggers. This is shown in a green box.
For example,
1 run (100.00%)indicates that the component ran one time, which accounts for 100% of the total flow triggers.NoteIf the percentage exceeds 100%, it usually means the component was involved in multiple interactions or was triggered multiple times by a jump component. A percentage over 100% occurs when the number of component triggers is greater than the number of flow triggers.
Run errors:
The number of times a component encountered an error within the specified time range. This is shown in a red box. You can click the red box to view the error message.
For example,
2 errorsindicates that the component encountered two exceptions or failures during its run.Not triggered:
The component was not executed within the specified time range. This is shown in a gray box.
Example diagram
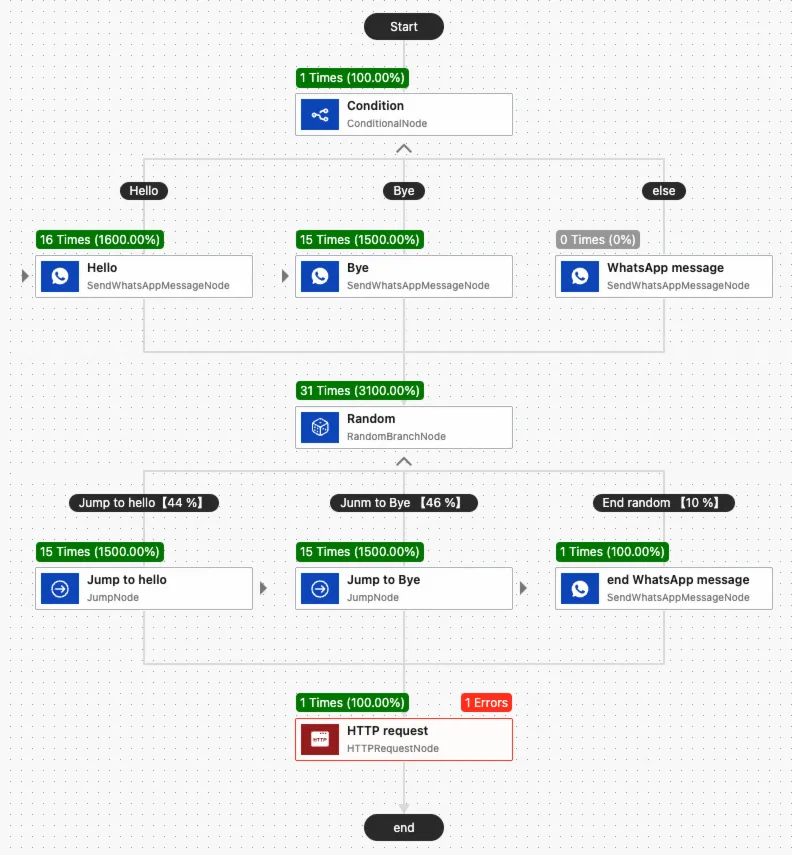
The following is the logical structure of the flow shown in the example diagram:
A mobile originated message from a user triggers the flow. The flow first passes through a Conditional Branch component to check if the message hits the preset keywords "Hello" or "Goodbye". Otherwise, the flow enters the
elsebranch.The flow then proceeds to a Random Branch component. The component has three possible outcomes:
A 44% probability of jumping to the "Hello" component.
A 46% probability of jumping to the "Goodbye" component.
A 10% probability of ending the flow directly and returning a corresponding message.
The flow then proceeds to an HTTP Request component and ends.
Example data
Assuming the flow was triggered one time within the query range, the data is as follows:
Conditional Branch component: Triggered 1 time, which is a 100% run percentage. (Because this is the first component in the flow, its trigger count equals the total flow trigger count and serves as the baseline for the run percentages of other components).
Hello component: Triggered 16 times, consisting of:
1 trigger from a user's mobile originated message hitting the keyword.
15 triggers from random jumps by the Random Branch component.
The total number of runs is 16. The run percentage is 1600% (16 component runs ÷ 1 flow trigger).
Goodbye component: Not triggered (0 times)
Send WhatsApp Message component under the else branch: Not triggered (0 times)
The Random Branch component was triggered a total of 31 times. These triggers consisted of 15 jumps to the Hello component, 15 jumps to the Goodbye component, and one action that ended the flow.