You can view the details of a scaling activity to learn the results of scaling activities triggered by scheduled tasks, event-triggered tasks, or manual execution of scaling rules.
Background information
The possible states of a scaling activity include Rejected, Executing, Successful, Warning, and Failed. For more information, see Status.
If not all the Elastic Compute Service (ECS) instances that are involved in a scale-out are added to a scaling group, Auto Scaling rolls back the ECS instances that failed to be added and considers the scale-out as a complete scaling activity. In this case, the scaling activity enters the Warning state. For more information, see ECS instance rollback.
Procedure
- Log on to the Auto Scaling console.
- In the left-side navigation pane, click Scaling Groups.
- In the top navigation bar, select the region where Auto Scaling is activated.
- Find a scaling group and use one of the following methods to go to the scaling group details page:
- Click the ID of the scaling group in the Scaling Group Name/ID column.
- Click Details in the Actions column.
In the upper part of the page that appears, click the Scaling Activities tab.
Find the scaling activity whose details you want to view and click its ID in the Scaling Activity ID column.
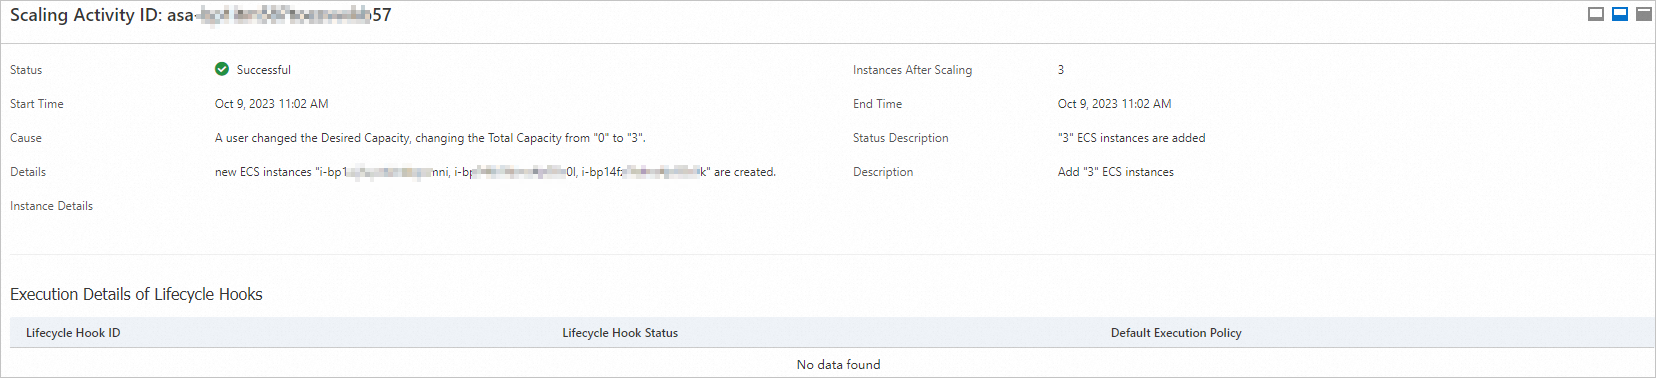
On the scaling activity details page, you can view the status and cause of the scaling activity. You can also view the total number of instances in the scaling group after the scaling activity is complete. Example: