After you add a Kubernetes cluster to a Service Mesh (ASM) instance, the Envoy sidecar proxies deployed on the data plane can print access logs for the cluster. ASM allows you to customize the fields of access logs printed by Envoy proxies -- such as specific request headers, response headers, or Envoy built-in variables -- to capture the data you need for troubleshooting and observability.
Prerequisites
Before you begin, make sure that you have:
Step 1: Enable access logging
The configuration path differs depending on your ASM instance version.
ASM instances earlier than v1.17.2.35
Log on to the ASM console. In the left-side navigation pane, choose Service Mesh > Mesh Management.
On the Mesh Management page, click the name of the target ASM instance. In the left-side navigation pane, choose ASM Instance > Base Information.
In the upper-right corner, click Settings.
In the Settings Update panel, select Enable access logging and print it to container stdout, then click OK.
After you enable this setting, the istio-proxy container outputs access logs in JSON format. If access logging is disabled, the istio-proxy container does not print access logs in JSON format. Each log entry contains the following default fields:
ASM instances v1.17.2.35 or later
ASM v1.17.2.35 and later provides granular log controls at three levels:
| Level | Scope |
|---|---|
| Global | All sidecar proxies and gateways in the mesh |
| Namespace | All workloads in a specific namespace |
| Custom | Specific workloads matched by label |
Log on to the ASM console. In the left-side navigation pane, choose Service Mesh > Mesh Management.
On the Mesh Management page, click the name of the target ASM instance. In the left-side navigation pane, choose Observability Management Center > Observability Settings.
On the Observability Settings page, select a tab based on the scope you want to configure:
Global -- Applies to all sidecar proxies and gateways in the mesh.
Namespace -- Click Create, then select a namespace from the Namespace drop-down list.
Custom -- Click Create, select a namespace from the Namespace drop-down list, then set Name and Matching Label to target specific workloads.
In the Log Settings section, turn on Enable Log Output, then click submit. Sidecar proxies and gateways on the data plane now print access logs to container standard output (stdout).
ASM also supports log filtering. For details, see Filter logs in "Configure observability settings".
Verify that logs are being generated. Run
kubectlagainst a sidecar proxy or an ingress gateway:Sidecar proxy:
kubectl logs <pod-name> -c istio-proxy --tail 1Ingress gateway:
kubectl -n istio-system logs <gateway-pod-name> --tail 1(Optional) View access logs in the Container Service for Kubernetes (ACK) console:
Log on to the ACK console. In the left-side navigation pane, click Clusters.
On the Clusters page, click the cluster name, then choose Workloads > Pods in the left-side navigation pane.
On the Pods page, click the pod name and open the Logs tab.
Step 2: Customize log fields
Beyond the default fields, you can customize log fields to capture specific request headers, response headers, or Envoy built-in variables.
ASM instances earlier than v1.17.2.35
Log on to the ASM console. In the left-side navigation pane, choose Service Mesh > Mesh Management.
On the Mesh Management page, click the name of the target ASM instance. In the left-side navigation pane, choose ASM Instance > Base Information.
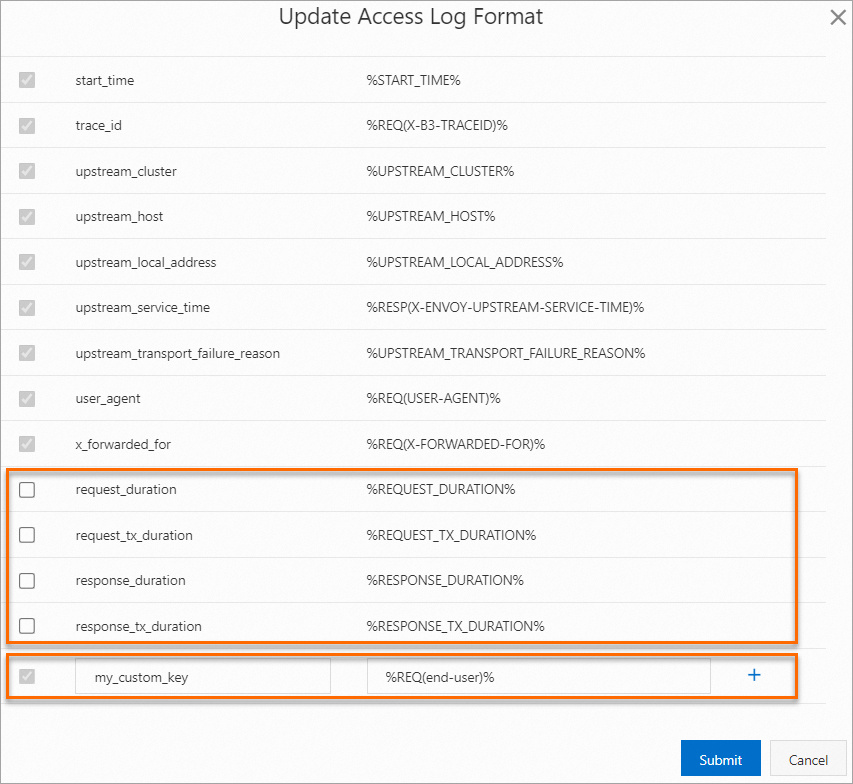
In the Config Info section, click Update Access Log Format next to Enable access logging and print it to container stdout.
In the Update Access Log Format dialog box, add a custom field: This example extracts the
end-userrequest header and writes it to the access log under the keymy_custom_key. You can select from the built-in optional fields provided by ASM or define your own.Set accessLogFormat key to the field name (for example,
my_custom_key).Set accessLogFormat value to the Envoy command operator (for example,
%REQ(end-user)%).Click OK.
ASM instances v1.17.2.35 or later
Log on to the ASM console. In the left-side navigation pane, choose Service Mesh > Mesh Management.
On the Mesh Management page, click the name of the target ASM instance. In the left-side navigation pane, choose Observability Management Center > Observability Settings.
On the Observability Settings page, select the Global, Namespace, or Custom tab.
Namespace tab: Click Create, then select a namespace from the Namespace drop-down list.
Custom tab: Click Create, select a namespace from the Namespace drop-down list, then set Name and Matching Label.
In the Log Settings section, customize the log format: Each log field value can come from one of the following sources: Example: To log the
Accept-Encodingrequest header, set accessLogFormat key toaccept-encoding, Type to Request Properties, and accessLogFormat value toAccept-Encoding.Select or deselect built-in fields.
Modify existing custom fields.
Click the
 icon to add a new field.
Click submit.
Log field customization requires Enable Log Output to be turned on. Default fields in the Log Format section are mandatory and cannot be modified.
Source type Description Example Request header A header from the incoming request Accept-Encoding,end-userResponse header A header from the upstream response X-Custom-ResponseEnvoy built-in variable An Envoy command operator %PROTOCOL%,%DURATION%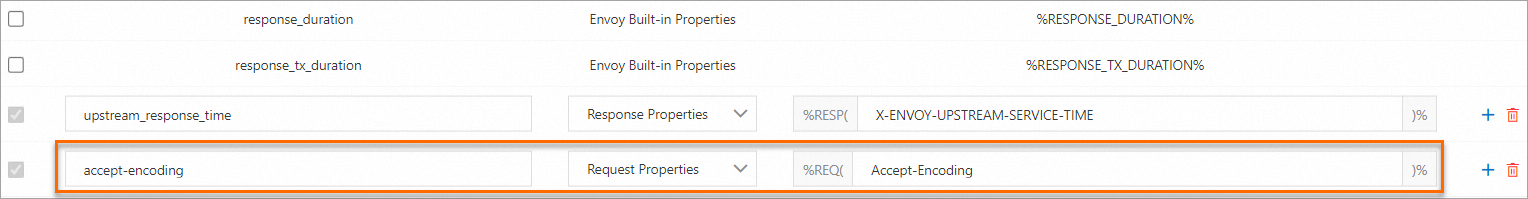
Verify the custom field appears in the logs:
kubectl logs <pod-name> -c istio-proxy --tail 1 | grep accept-encoding --color=autoThe
accept-encodingfield now appears in the log output with the valuegzip.
Step 3: View access logs
After you enable access logging and customize log fields, sidecar proxies print logs in the updated format for every request they handle. Use the Bookinfo sample application to verify end-to-end:
Open
http://<ingress-gateway-IP>/productpagein your browser to generate traffic.Log on to the ACK console. In the left-side navigation pane, click Clusters.
On the Clusters page, click the cluster name, then choose Workloads > Deployments in the left-side navigation pane.
Select default from the Namespace drop-down list, then click Details in the Actions column for the productpage-v1 deployment.
On the deployment details page, click the Logs tab and set Container to istio-proxy. The log output shows the custom fields you configured. For example, a field specifying
end-user: jasonconfirms that custom log extraction is working.
Duration fields reference
Use these fields to diagnose latency issues in the request lifecycle.
In service mesh terminology, upstream refers to the service receiving a request, and downstream refers to the service initiating a request. For example, when service A calls service B, A is downstream and B is upstream.
| Field | Envoy variable | Description (HTTP) | Description (TCP) |
|---|---|---|---|
duration | %DURATION% | Time from when the proxy starts reading the request to when it sends the last response byte. This is the total processing time. | Duration of the downstream connection. |
request_duration | %REQUEST_DURATION% | Time to read the entire request (header + body) from the downstream service. A high value may indicate network congestion or I/O bottlenecks. | Not available (outputs -). |
request_tx_duration | %REQUEST_TX_DURATION% | Time from request initiation to sending the last request byte to the upstream service. A high value may indicate network issues or I/O bottlenecks between the proxy and upstream. | Not available (outputs -). |
response_duration | %RESPONSE_DURATION% | Time from request initiation to reading the first response byte from the upstream service. If this value is high but request_tx_duration is normal, the upstream service likely has a performance bottleneck. | Not available (outputs -). |
response_tx_duration | %RESPONSE_TX_DURATION% | Time from reading the first response byte from the upstream service to sending the last response byte to the downstream service. A high value may indicate network issues or I/O bottlenecks. | Not available (outputs -). |
upstream_service_time (sidecar) / upstream_response_time (gateway) | %RESP(X-ENVOY-UPSTREAM-SERVICE-TIME)% | Processing time of the upstream service plus network overhead. A high value may indicate slow upstream processing or high network latency. | -- |
For HTTP requests with a body (Content-Length > 0), the proxy reads and forwards the request simultaneously -- it does not buffer the full request body before forwarding. As a result, slow reads from the downstream service can increase the upstream service's perceived processing time.What's next
Configure observability settings -- Manage logging, tracing, and metrics at the mesh level.
Enable control-plane log collection and alerting -- Collect control-plane logs and set up alerts (ASM v1.17.2.35 or later).
Collect access logs with Simple Log Service -- Forward data plane access logs to SLS for centralized analysis.