This topic describes how to use Managed Service for Prometheus to monitor Nebula Graph services.
Prerequisites
Elastic Compute Service (ECS) instances on which Nebula Graph services are deployed in different virtual private clouds (VPCs) are monitored by Prometheus Service. For more information, see Create a Prometheus instance to monitor an ECS instance.
Disadvantages of using a self-managed Prometheus service to monitor Nebula Graph services
When you use a self-managed Prometheus service to monitor Nebula Graph services that are deployed on ECS instances in different VPCs, the following issues may occur:
To ensure security and facilitate organization management, we recommend that you deploy business in separate VPCs. If you want to use a self-managed Prometheus service to monitor your business, you must deploy the self-managed Prometheus service in each VPC. This increases deployment and O&M costs.
You must deploy and configure Prometheus, Grafana, and Alertmanager to build a self-managed monitoring system. The process is complex and requires a long time to complete.
A self-managed Prometheus service does not have a service discovery mechanism that can be quickly implemented for Alibaba Cloud ECS. The services that are deployed on ECS instances cannot be identified based on ECS tags. If you want to implement a service discovery mechanism, you must write code in Golang to call the POP API of Alibaba Cloud ECS and integrate the open source Prometheus service. Then, you must compile and package the code, and deploy the open source Prometheus service. This process is complex and causes difficulties in version upgrades.
You cannot create custom dashboards in open source Grafana based on the working mechanisms of monitoring components and best practices.
Self-managed Prometheus services do not have alerting templates for Nebula Graph services. You must configure alert rules, which causes heavy workloads and technological challenges.
Comparison between self-managed Prometheus services and Managed Service for Prometheus
The following table describes the differences between using self-managed Prometheus services and Managed Service for Prometheus to monitor Nebula Graph services.
Item | Self-managed Prometheus service | Managed Service for Prometheus |
Deployment costs and O&M costs | You must purchase ECS instances to deploy Prometheus, Grafana, and Alertmanager in multiple VPCs. This leads to high O&M costs. | Managed Service for Prometheus integrates Prometheus, Grafana, and Alertmanager to provide fully managed, out-of-the-box, and O&M-free capabilities. |
Availability, performance, and storage capacity | The overall performance and availability are poor, and the storage capacity is small. | The overall performance and availability are high, and the storage capacity is large. |
Service discovery | The service discovery of ECS instances is implemented by using the static_configs parameter in open source Prometheus or third-party service registries. The service discovery process is complex and requires high maintenance costs. | Similar to the label selector in Kubernetes, the aliyun_sd_configs parameter allows you to use ECS tags to match ECS instances. This simplifies service configuration and O&M tasks. |
Grafana dashboards | Open source Grafana dashboards show only the collected metrics. You cannot add custom metrics based on the working mechanism of Nebula Graph and best practices for monitoring Nebula Graph services. | Managed Service for Prometheus provides professional dashboard templates that you can use to monitor Nebula Graph services. The dashboards allow you to quickly obtain an accurate status overview of Nebula Graph services and helps you troubleshoot issues. |
Alert rules | No alerting template is available for monitoring Nebula Graph services. You must select metrics and configure alert rules based on your business requirements. | Managed Service for Prometheus provides professional and flexible alerting templates based on the best practices for monitoring Nebula Graph services. You can configure alert rules on the GUI. |
Based on the preceding table, you can use Managed Service for Prometheus to simplify the O&M process and reduce O&M costs. For information about how to use Managed Service for Prometheus, see Use Managed Service for Prometheus to monitor Nebula Graph services.
Use Managed Service for Prometheus to monitor Nebula Graph services
Procedures
Procedure 1: Integration Center of Managed Service for Prometheus
Log on to the ARMS console.
In the left-side navigation pane, choose .
Click the name of the Prometheus instance instance that you want to manage to go to the Integration Center page.
Procedure 2: Integration Center in the ARMS console
Log on to the Application Real-time Monitoring Service (ARMS) console.
In the left-side navigation pane, click Integration Center. On the Integration Center page, click Nebula in the Application Components section. In the Monitor Nebula panel, follow the on-screen instructions to add the component.
Step 1: Install and configure a Nebula exporter
This section describes how to install and configure a Nebula exporter on the Integration Center page of Managed Service for Prometheus.
Install a Nebula exporter.
If you install a Nebula exporter for the first time, perform the following operation:
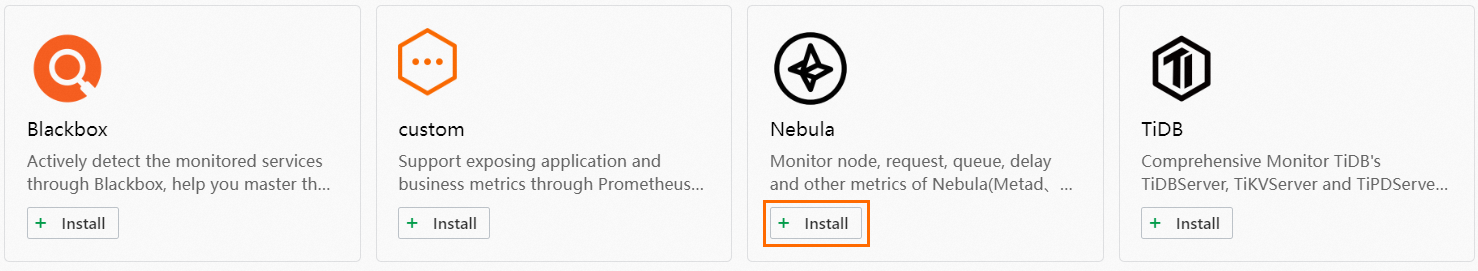
In the uninstalled section of the Integration Center page, find the Nebula exporter and click Install.
If you have installed a Nebula exporter, you need to add the exporter again:
In the Installed section of the Integration Center page, click Add on the Nebula exporter.
On the Configuration tab in the STEP2 section, configure the parameters and click OK. The following table describes the parameters.
Parameter
Description
Exporter Name
The name of the Nebula exporter. We recommend that you use the name of the Nebula Graph service.
MetaD metrics listening port
The listening ports of Nebula Graph components. Managed Service for Prometheus can obtain metric data over the ports.
GraphD metrics listening port
StorageD metrics listening port
MetaD ECS Label Key(Service Discovery)
The tag keys of Nebula Graph components. The tags are attached to ECS instances in VPCs to allow Managed Service for Prometheus to identify the required ECS instances based on tags.
GraphD ECS Label Key(Service Discovery)
StorageD ECS Label Key(Service Discovery)
Label value of MetaD monitor
The tag values of Nebula Graph components. The tags are attached to ECS instances in VPCs.
Label value of GraphD monitor
Label value of StorageD monitor
Metrics scrape interval (seconds)
The interval at which Managed Service for Prometheus collects Nebula Graph monitoring data. Default value: 30. Unit: seconds.
NoteYou can view the monitoring metrics on the Metrics tab in the STEP2 section.
The installed components are displayed in the Installed section of the Integration Center page. Click the component. In the panel that appears, you can view information such as targets, metrics, dashboard, alerts, service discovery configurations, and exporters. For more information, see Integration center.
Step 2: View the Nebula Graph monitoring data on the dashboards
By default, Managed Service for Prometheus provides Grafana dashboards that you can use to monitor Nebula Graph services. You can view the monitoring data of Nebula Graph components on the dashboards without the need to deploy a Grafana service.
In the Installed section of the Integration Center page, click the Nebula exporter. In the Nebula panel, click the Dashboards tab to view the thumbnails and hyperlinks of Nebula dashboards. Click a hyperlink to go to the Grafana page and view the dashboard. 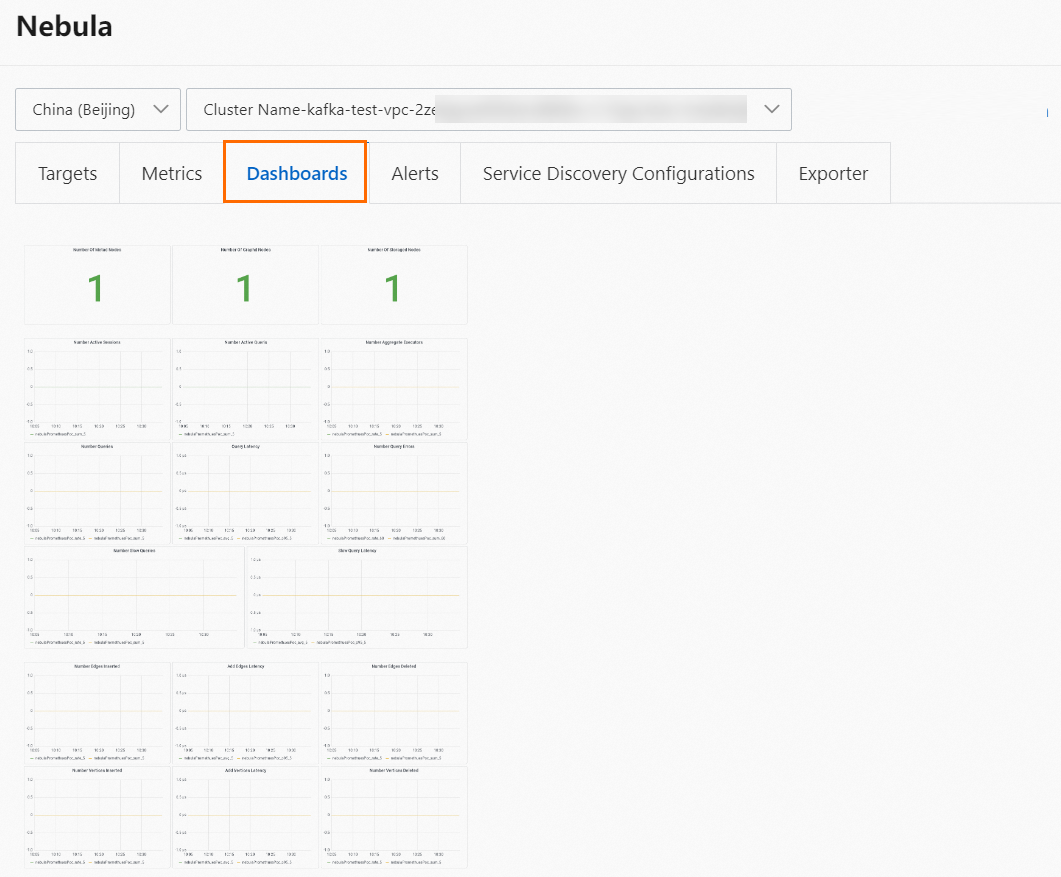
Step 3: Configure alert rules for monitoring Nebula Graph services
In the Installed section of the Integration Center page, click the Nebula exporter. In the Nebula panel, click the Alerts tab and select Nebula from the Alert Contact Group drop-down list to view the alert rules that are configured in Managed Service for Prometheus for monitoring Nebula Graph services.
Managed Service for Prometheus creates the recommended alert rules for Nebula Graph components. You can change the thresholds of the alert rules, and then enable the alert rules. You can also create alert rules based on your business requirements. For more information, see Create an alert rule for a Prometheus instance.